Here’s a summary of the chart you provided:
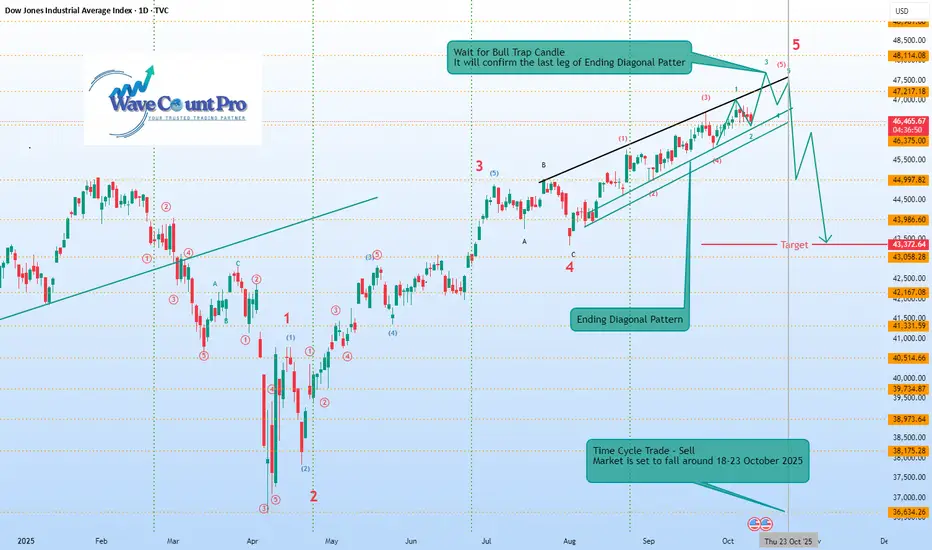
Index: Dow Jones Industrial Average (DJIA), Daily timeframe (2025).
Pattern: Ending Diagonal Pattern forming in Wave 5.
Wave Count:
Major impulse structure labeled 1–5, with sub-waves marked inside the Ending Diagonal.
Current move is in the final 5th wave, nearing completion.
Key Message:
A Bull Trap Candle is expected — it will confirm the final leg of the Ending Diagonal.
After that, a sharp correction (sell-off) is anticipated.
Target Zone: Around 43,372–43,058.
Time Cycle Note:
A Time Cycle Trade (Sell) is suggested.
Market is projected to fall between October 18–23, 2025.
In short, the chart forecasts the completion of an Ending Diagonal near 47,200–47,500 levels, followed by a significant downside move toward the 43,000 zone starting late October 2025.
거래청산: 타겟 닿음
Technical Analyst BY Passion
면책사항
해당 정보와 게시물은 금융, 투자, 트레이딩 또는 기타 유형의 조언이나 권장 사항으로 간주되지 않으며, 트레이딩뷰에서 제공하거나 보증하는 것이 아닙니다. 자세한 내용은 이용 약관을 참조하세요.
Technical Analyst BY Passion
면책사항
해당 정보와 게시물은 금융, 투자, 트레이딩 또는 기타 유형의 조언이나 권장 사항으로 간주되지 않으며, 트레이딩뷰에서 제공하거나 보증하는 것이 아닙니다. 자세한 내용은 이용 약관을 참조하세요.