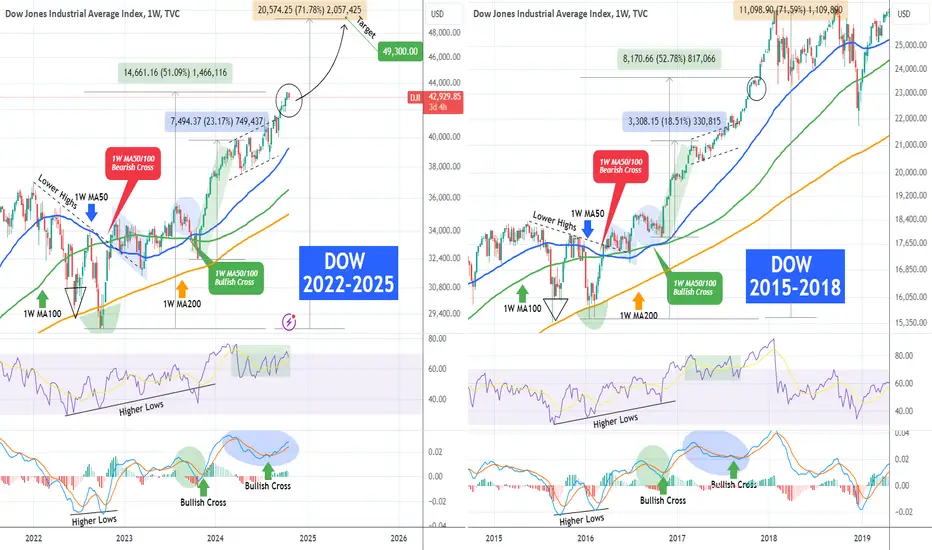
More than a year ago (September 13 2023, see chart below), we posted a long-term fractal comparison for Dow Jones (DJI) between the 2022 - 2025 and 2015 - 2018 periods:

As you can see the 1W MA50/100 Bullish Cross eventually placed the index on a huge rally (even though it had to go lower for a month) that hit Target 1 at 42000. The 1W RSI and MACD sequences in 2024 however evolved in such a how that we have to re-adjust the patterns in order to fit the 2017 price action.
The charts now display very symmetric fractals and it appears that we are now on a short-term consolidation (circle) after a +50% rise from the September 2022 bottom. In November 2017, that was the final consolidation before the most aggressive rally of the Bull Cycle that made Dow top and then pull back to test its 1W MA50 (blue trend-line).
As a result, we move our final target even higher at 49300, which represents a +71% rise from the 2022 bottom, similar to the rise that priced the January 2018 High.
-------------------------------------------------------------------------------
** Please LIKE 👍, FOLLOW ✅, SHARE 🙌 and COMMENT ✍ if you enjoy this idea! Also share your ideas and charts in the comments section below! This is best way to keep it relevant, support us, keep the content here free and allow the idea to reach as many people as possible. **
-------------------------------------------------------------------------------
💸💸💸💸💸💸
👇 👇 👇 👇 👇 👇
👑Best Signals (Forex/Crypto+70% accuracy) & Account Management (+20% profit/month on 10k accounts)
💰Free Channel t.me/tradingshotglobal
🤵Contact info@tradingshot.com t.me/tradingshot
🔥New service: next X100 crypto GEMS!
💰Free Channel t.me/tradingshotglobal
🤵Contact info@tradingshot.com t.me/tradingshot
🔥New service: next X100 crypto GEMS!
면책사항
이 정보와 게시물은 TradingView에서 제공하거나 보증하는 금융, 투자, 거래 또는 기타 유형의 조언이나 권고 사항을 의미하거나 구성하지 않습니다. 자세한 내용은 이용 약관을 참고하세요.