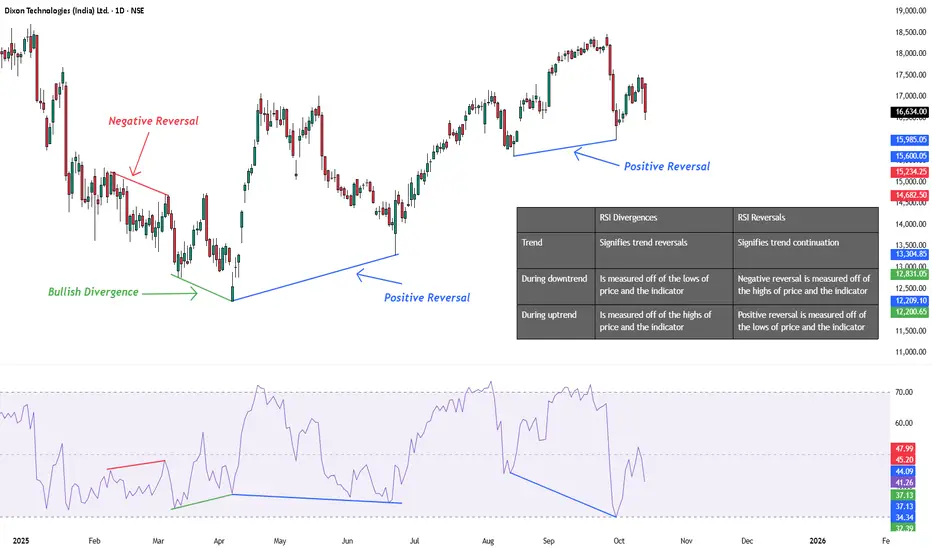
While most traders look for RSI divergences to catch tops and bottoms, RSI reversals often go unnoticed — yet they mark trend continuation points with precision.
In Dixon’s case, positive RSI reversals have repeatedly emerged at higher lows — each time leading to a renewed rally. The indicator is quietly hinting that the broader uptrend remains intact unless these structural lows break.
RSI Note:
Positive reversals = trend continuation.
Divergences = trend reversal signals.
Strategy:
Bias stays bullish as long as the recent higher-low structure holds.
Disclaimer:
This analysis is for educational purposes only and does not constitute investment advice. Please do your own research (DYOR) before making any trading decisions.
WaveXplorer | Elliott Wave insights
📊 X profile: @veerappa89
📊 X profile: @veerappa89
관련 발행물
면책사항
이 정보와 게시물은 TradingView에서 제공하거나 보증하는 금융, 투자, 거래 또는 기타 유형의 조언이나 권고 사항을 의미하거나 구성하지 않습니다. 자세한 내용은 이용 약관을 참고하세요.
WaveXplorer | Elliott Wave insights
📊 X profile: @veerappa89
📊 X profile: @veerappa89
관련 발행물
면책사항
이 정보와 게시물은 TradingView에서 제공하거나 보증하는 금융, 투자, 거래 또는 기타 유형의 조언이나 권고 사항을 의미하거나 구성하지 않습니다. 자세한 내용은 이용 약관을 참고하세요.