Thanks for the clarification! Yes — the chart **does** resemble an **Inverted Head and Shoulders** pattern (a bullish reversal pattern), especially visible in the price structure before the breakout above ₹6,278.
---
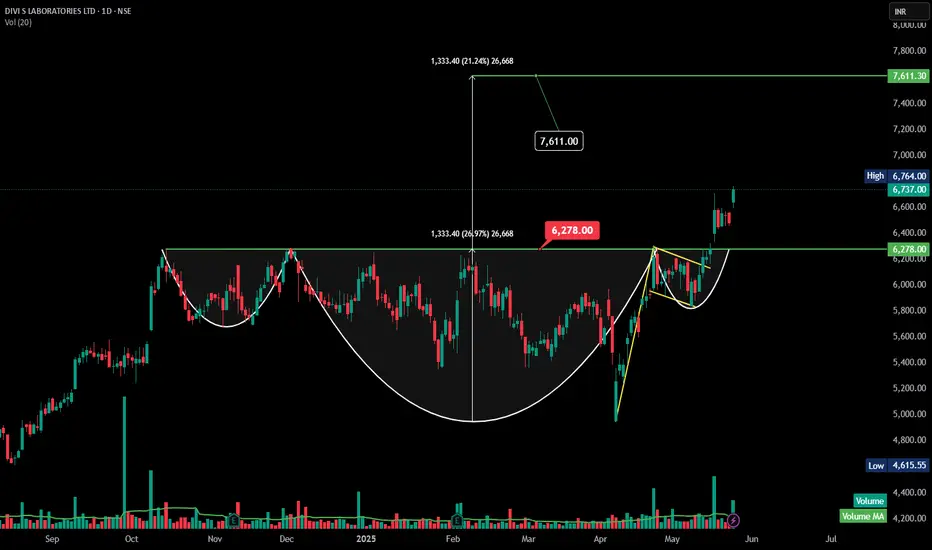
### 🟢 **Inverted Head and Shoulders – Analysis (Divi's Lab)**
#### **Pattern Structure:**
* **Left Shoulder:** Formed in March.
* **Head:** Deepest low around early April.
* **Right Shoulder:** Higher low formed in late April to early May.
* **Neckline:** Breakout above the ₹6,278 level confirms the pattern.
#### **Breakout Confirmation:**
* Breakout is strong, supported by **increasing volume**.
* Target derived from neckline to head height = approx. ₹1,333.
* **Target after breakout:** ₹6,278 + ₹1,333 = **₹7,611** (already marked on the chart).
---
---
### 🟢 **Inverted Head and Shoulders – Analysis (Divi's Lab)**
#### **Pattern Structure:**
* **Left Shoulder:** Formed in March.
* **Head:** Deepest low around early April.
* **Right Shoulder:** Higher low formed in late April to early May.
* **Neckline:** Breakout above the ₹6,278 level confirms the pattern.
#### **Breakout Confirmation:**
* Breakout is strong, supported by **increasing volume**.
* Target derived from neckline to head height = approx. ₹1,333.
* **Target after breakout:** ₹6,278 + ₹1,333 = **₹7,611** (already marked on the chart).
---
면책사항
해당 정보와 게시물은 금융, 투자, 트레이딩 또는 기타 유형의 조언이나 권장 사항으로 간주되지 않으며, 트레이딩뷰에서 제공하거나 보증하는 것이 아닙니다. 자세한 내용은 이용 약관을 참조하세요.
면책사항
해당 정보와 게시물은 금융, 투자, 트레이딩 또는 기타 유형의 조언이나 권장 사항으로 간주되지 않으며, 트레이딩뷰에서 제공하거나 보증하는 것이 아닙니다. 자세한 내용은 이용 약관을 참조하세요.