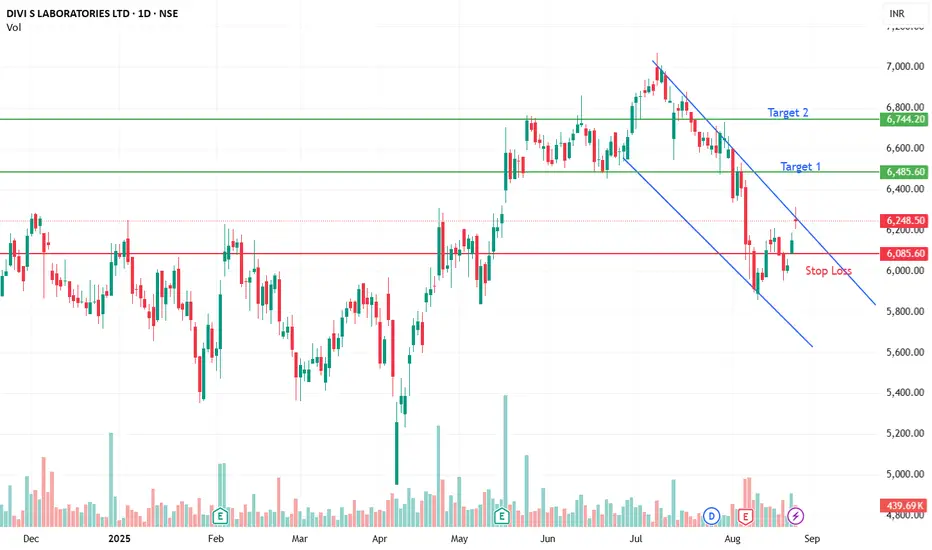
Entry @6248
✅ Overall View
Current Price: ₹6248.50
RSI (Relative Strength Index): 47.62 → This indicates a neutral zone (neither overbought nor oversold).
✅ Support and Resistance Levels
Supports:
S1: ₹6010
S2: ₹6020.35
S3: ₹6162
Price is above all supports, which is positive.
Resistances:
R1: ₹6248.90 (current price is very close)
R2: ₹6275.85
R3: ₹6282.50
The stock is near its immediate resistance, so watch for a breakout above ₹6249–₹6282.
✅ Fibonacci Levels
Key levels derived from previous swing:
23.6%: ₹3754.59
38.2%: ₹4388.45
50%: ₹4900.75
61.8%: ₹5413.05
78.6%: ₹6142.42 (Price is above this level → bullish sign)
✅ Moving Averages
Short-Term:
EMA5 = ₹6141.71, SMA5 = ₹6102.50 → Price is above both → short-term trend is positive.
EMA9 = ₹6136.91, SMA9 = ₹6096.78 → Also bullish short-term.
Medium-Term:
EMA20 = ₹6237.30, SMA20 = ₹6240.43 → Price is slightly above → neutral to bullish.
Long-Term:
EMA50 = ₹6383.40, SMA50 = ₹6532.76 → Price is below → long-term still weak.
EMA200 = ₹6038.53, SMA200 = ₹6107.82 → Price is above → long-term trend is positive.
✅ Interpretation
RSI near 47 → Neutral (not overbought or oversold).
Price near immediate resistance (6248.90) → If breaks above ₹6282 with volume, bullish momentum possible.
Above major Fibonacci (78.6%) and above 200-day EMA/SMA → Long-term bullish bias.
Medium-term and short-term averages show slight strength but need a breakout above ₹6282 for strong uptrend.
면책사항
해당 정보와 게시물은 금융, 투자, 트레이딩 또는 기타 유형의 조언이나 권장 사항으로 간주되지 않으며, 트레이딩뷰에서 제공하거나 보증하는 것이 아닙니다. 자세한 내용은 이용 약관을 참조하세요.
면책사항
해당 정보와 게시물은 금융, 투자, 트레이딩 또는 기타 유형의 조언이나 권장 사항으로 간주되지 않으며, 트레이딩뷰에서 제공하거나 보증하는 것이 아닙니다. 자세한 내용은 이용 약관을 참조하세요.