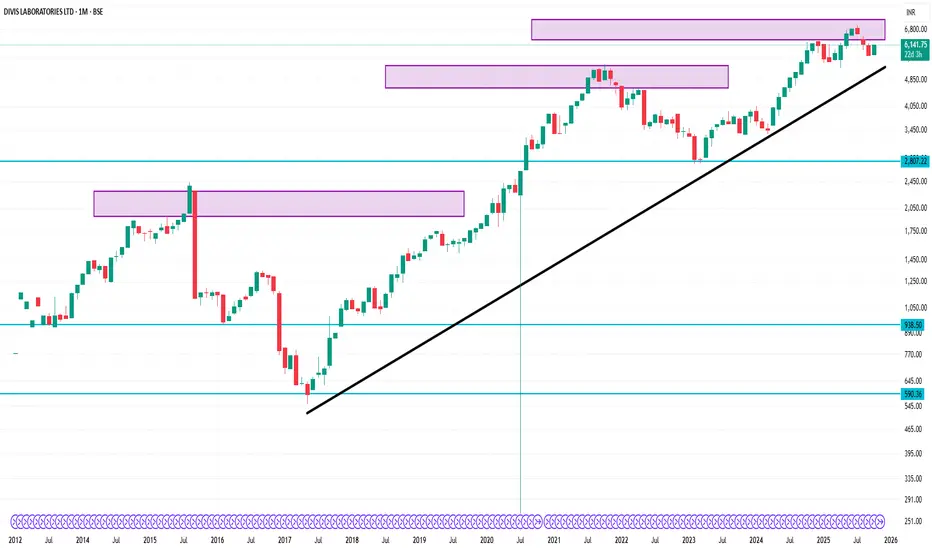
📈 1-Month Performance Snapshot (September 9 – October 9, 2025)
Opening Price (Sep 9, 2025): ₹6,025.00
Closing Price (Oct 9, 2025): ₹6,149.00
Price Change: +₹124.00 (+2.06%)
52-Week Range: ₹4,955.00 – ₹7,071.50
Current Price vs. 52-Week High: -12.98%
Current Price vs. 52-Week Low: +24.14%
Trading Volume (Oct 9): Approximately 129,890 shares
5-Day Moving Average: ₹6,128.00
20-Day Exponential Moving Average (EMA): ₹6,110.08
1-Month Return: +1.54%
📊 Recent Performance Highlights
October 8, 2025: Closed at ₹6,120.50 (+0.26%)
October 7, 2025: Closed at ₹6,104.50 (+4.77%)
October 6, 2025: Closed at ₹5,826.50 (-0.67%)
October 3, 2025: Closed at ₹5,866.00 (+2.73%)
October 1, 2025: Closed at ₹5,710.00 (+0.36%)
🧾 Key Financial Metrics
P/E Ratio (TTM): 70.29
EPS (TTM): ₹86.80
Market Capitalization: ₹1.62 trillion
Dividend Yield: 0.49%
Debt-to-Equity Ratio: 0.00 (indicating a debt-free status)
관련 발행물
면책사항
해당 정보와 게시물은 금융, 투자, 트레이딩 또는 기타 유형의 조언이나 권장 사항으로 간주되지 않으며, 트레이딩뷰에서 제공하거나 보증하는 것이 아닙니다. 자세한 내용은 이용 약관을 참조하세요.
관련 발행물
면책사항
해당 정보와 게시물은 금융, 투자, 트레이딩 또는 기타 유형의 조언이나 권장 사항으로 간주되지 않으며, 트레이딩뷰에서 제공하거나 보증하는 것이 아닙니다. 자세한 내용은 이용 약관을 참조하세요.