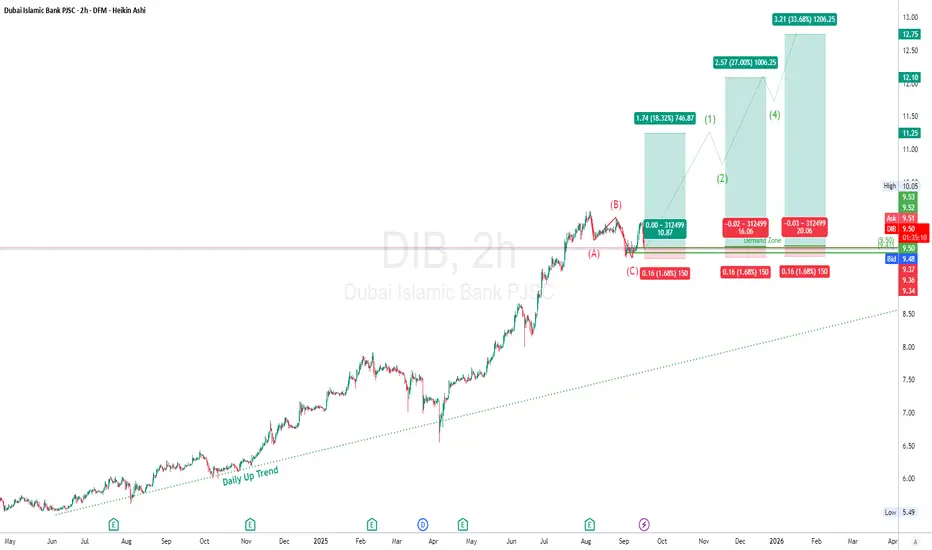
DIB has been in a solid daily uptrend since mid-2024, respecting the rising trendline.
Recently, price completed an ABC corrective structure, pulling back from 12.10 highs → 9.50s.
It is now sitting at the demand zone (9.35–9.50), with signs of buyers stepping back in.
Trend & Structure
Macro Trend: Bullish (higher highs/lows intact).
Current Phase: End of Wave (C) correction.
Next Cycle Projection: Elliott Wave 1–5 up, with 12.75+ targets in sight.
Supply & Demand
Demand Zone (Strong Support): 9.35 – 9.50 (already tested).
Next Resistance Levels (Supply):
11.25
12.10 (previous high)
12.75 (projected Wave 5 target)
Elliott Wave Outlook
Completed: (A)-(B)-(C) correction.
Next: Bullish cycle projected → Wave (1) → (2) → (3) → (4) → (5) toward 12.75.
Measured projections:
Wave (1): 10.87 (+18%)
Wave (3): 12.10 (+27%)
Wave (5): 12.75 (+33%)
💰 Trade Idea
Entry Zone: 9.50 – 9.55 (demand zone bounce).
Stop Loss: 9.35 (below demand).
Take Profit Levels:
TP1: 10.87 (Wave 1)
TP2: 12.10 (Wave 3)
TP3: 12.75 (Wave 5)
🎯 Risk/Reward :
To TP1 = ~1:7
To TP2 = ~1:12
To TP3 = ~1:18+
⚖ Risk Management
Max risk per trade = 1–2% of portfolio.
Move SL to Break-Even (BE) once TP1 is hit.
Scale out 30% at TP1, 30% at TP2, hold rest for TP3.
"In trading, the key is not being right, but having an edge and sticking to it." – Paul Tudor Jones
⚠️ Disclaimer
This is not financial advice. For educational purposes only. Always DYOR before trading.
By Dubai Traders Hub
Follow us on X , YouTube, and Join our Telegram Channel
Follow us on X , YouTube, and Join our Telegram Channel
면책사항
이 정보와 게시물은 TradingView에서 제공하거나 보증하는 금융, 투자, 거래 또는 기타 유형의 조언이나 권고 사항을 의미하거나 구성하지 않습니다. 자세한 내용은 이용 약관을 참고하세요.
By Dubai Traders Hub
Follow us on X , YouTube, and Join our Telegram Channel
Follow us on X , YouTube, and Join our Telegram Channel
면책사항
이 정보와 게시물은 TradingView에서 제공하거나 보증하는 금융, 투자, 거래 또는 기타 유형의 조언이나 권고 사항을 의미하거나 구성하지 않습니다. 자세한 내용은 이용 약관을 참고하세요.