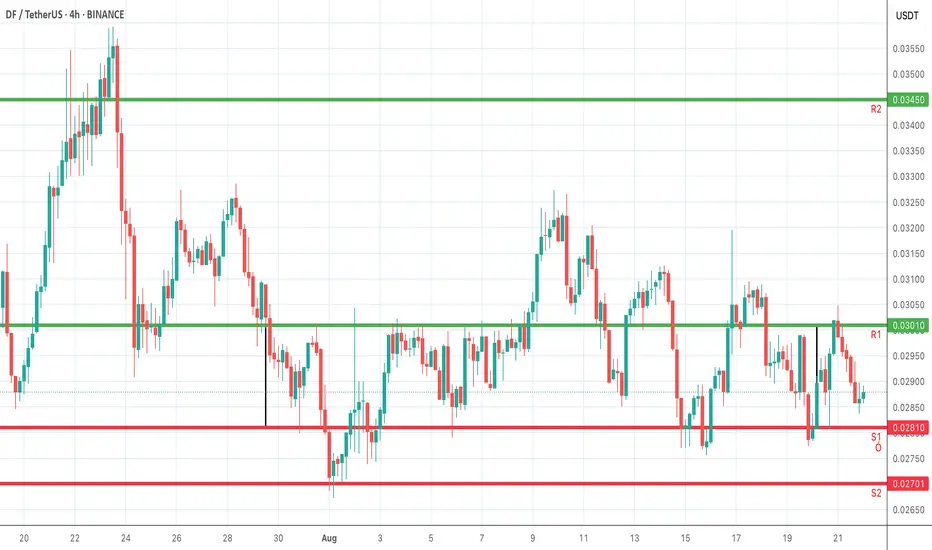
On the 4-hour chart, key support and resistance zones have been plotted. S1 and S2 represent the downside levels where demand could emerge, offering potential rebound points. R1 and R2 indicate resistance barriers on the upside, where selling pressure or profit-taking may appear. Monitoring price action around these levels is crucial: a breakout above resistance suggests bullish continuation, while a breakdown below support could signal further downside. Traders can align entries, exits, and stop-losses with these zones while confirming moves through trend and momentum indicators.
면책사항
이 정보와 게시물은 TradingView에서 제공하거나 보증하는 금융, 투자, 거래 또는 기타 유형의 조언이나 권고 사항을 의미하거나 구성하지 않습니다. 자세한 내용은 이용 약관을 참고하세요.
면책사항
이 정보와 게시물은 TradingView에서 제공하거나 보증하는 금융, 투자, 거래 또는 기타 유형의 조언이나 권고 사항을 의미하거나 구성하지 않습니다. 자세한 내용은 이용 약관을 참고하세요.