Hit like & follow guys ;)
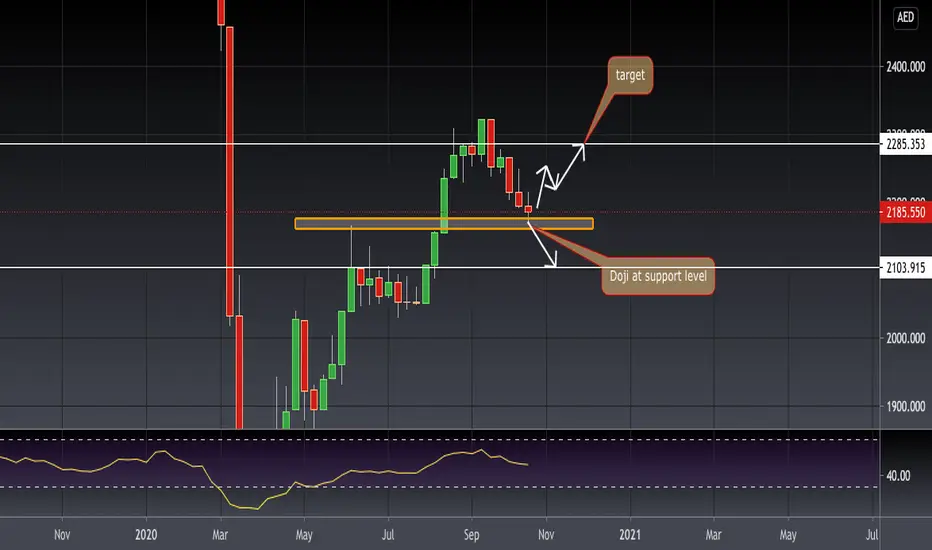
If we analyse weekly chart the uptrend is still intact and we are seeing a perfect doji candle at the support level. Good chances of market continuing its uptrend from this level. If 2185 holds up and if we can see a weekly candle close above 2220 it will be a good sign that market want to go higher. But at the same time if this level does not hold market can quickly slip to 2100 levels. Over all on a bigger time frame it looks bullish.
If we analyse weekly chart the uptrend is still intact and we are seeing a perfect doji candle at the support level. Good chances of market continuing its uptrend from this level. If 2185 holds up and if we can see a weekly candle close above 2220 it will be a good sign that market want to go higher. But at the same time if this level does not hold market can quickly slip to 2100 levels. Over all on a bigger time frame it looks bullish.
면책사항
해당 정보와 게시물은 금융, 투자, 트레이딩 또는 기타 유형의 조언이나 권장 사항으로 간주되지 않으며, 트레이딩뷰에서 제공하거나 보증하는 것이 아닙니다. 자세한 내용은 이용 약관을 참조하세요.
면책사항
해당 정보와 게시물은 금융, 투자, 트레이딩 또는 기타 유형의 조언이나 권장 사항으로 간주되지 않으며, 트레이딩뷰에서 제공하거나 보증하는 것이 아닙니다. 자세한 내용은 이용 약관을 참조하세요.