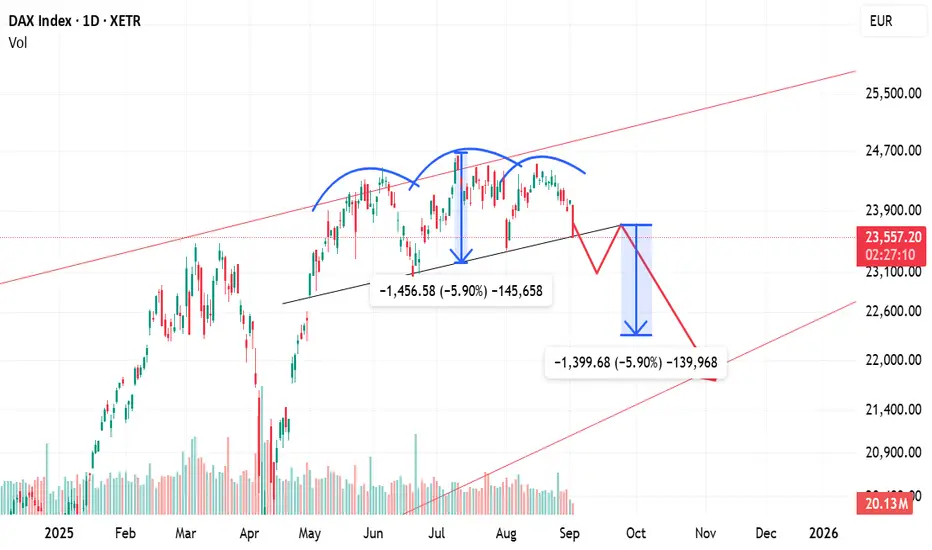
The DAX index is currently forming a Head and Shoulders pattern on the daily chart, a well-known bearish reversal formation. This pattern typically signals a potential shift in trend from bullish to bearish if the breakdown occurs.
Left Shoulder – Formed when prices peaked, followed by a correction.
Head – A higher peak, marking the top of the uptrend, followed by another decline.
Right Shoulder – A lower high compared to the head, showing weakening bullish momentum.
Neckline – The key support line connecting the lows between the shoulders and the head.
⚖️ Implications
If the DAX breaks below the neckline with strong volume, it will confirm the pattern.
This breakdown could trigger further downward momentum, with potential targets calculated by measuring the distance from the head to the neckline and projecting it downward.
✅ Summary
Pattern: Head & Shoulders (bearish) on daily chart.
Trigger: Breakdown below the neckline.
Outcome: Increased probability of further decline, with downside targets extending to lower support zones.
노트
Still waiting for the breakdown면책사항
이 정보와 게시물은 TradingView에서 제공하거나 보증하는 금융, 투자, 거래 또는 기타 유형의 조언이나 권고 사항을 의미하거나 구성하지 않습니다. 자세한 내용은 이용 약관을 참고하세요.
면책사항
이 정보와 게시물은 TradingView에서 제공하거나 보증하는 금융, 투자, 거래 또는 기타 유형의 조언이나 권고 사항을 의미하거나 구성하지 않습니다. 자세한 내용은 이용 약관을 참고하세요.