Hello Traders,
In this short-term analysis, we will have a look at the German DAX Index.
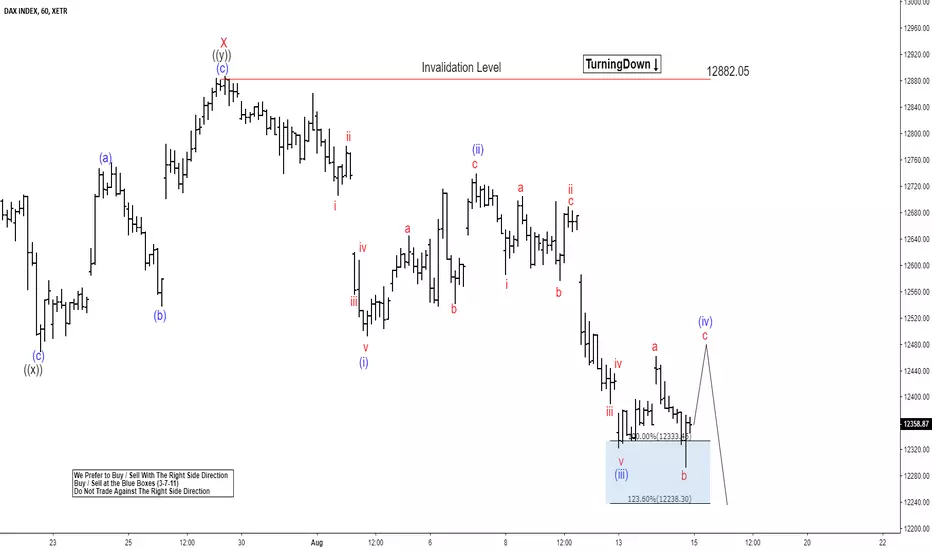
DAX short-term Elliott wave analysis suggests that the rally to 12882.05 high ended red wave X bounce. The internals of that bounce unfolded as Elliott wave double three structure where black wave ((w)) ended at 12640.87. Black wave ((x)) ended at 12468.68 and black wave ((y)) of red X ended at 12882.05 high.
Down from there, DAX is currently suggesting that it is unfolding as a potential 5 waves structure. Where blue wave (i) ended at 02/08/18 low (12491.53), blue wave (ii) pullback at 07/08/18 peak (12740.66), and blue wave (iii) at 08/13/18 low (12321.45). Currently, it is in the progress of making a pullback in blue wave (iv) before extending 1 more leg lower in blue wave (v) before a 3 waves bounce higher can be seen. We don’t like selling it.
In this short-term analysis, we will have a look at the German DAX Index.
DAX short-term Elliott wave analysis suggests that the rally to 12882.05 high ended red wave X bounce. The internals of that bounce unfolded as Elliott wave double three structure where black wave ((w)) ended at 12640.87. Black wave ((x)) ended at 12468.68 and black wave ((y)) of red X ended at 12882.05 high.
Down from there, DAX is currently suggesting that it is unfolding as a potential 5 waves structure. Where blue wave (i) ended at 02/08/18 low (12491.53), blue wave (ii) pullback at 07/08/18 peak (12740.66), and blue wave (iii) at 08/13/18 low (12321.45). Currently, it is in the progress of making a pullback in blue wave (iv) before extending 1 more leg lower in blue wave (v) before a 3 waves bounce higher can be seen. We don’t like selling it.
14 days trial --> elliottwave-forecast.com/plan-trial/ and get Accurate & timely Elliott Wave Forecasts of 78 instruments. Webinars, Chat Room, Stocks/Forex/Indices Signals & more.
면책사항
이 정보와 게시물은 TradingView에서 제공하거나 보증하는 금융, 투자, 거래 또는 기타 유형의 조언이나 권고 사항을 의미하거나 구성하지 않습니다. 자세한 내용은 이용 약관을 참고하세요.
14 days trial --> elliottwave-forecast.com/plan-trial/ and get Accurate & timely Elliott Wave Forecasts of 78 instruments. Webinars, Chat Room, Stocks/Forex/Indices Signals & more.
면책사항
이 정보와 게시물은 TradingView에서 제공하거나 보증하는 금융, 투자, 거래 또는 기타 유형의 조언이나 권고 사항을 의미하거나 구성하지 않습니다. 자세한 내용은 이용 약관을 참고하세요.