DAVE ( DAVE) — A Model CANSLIM Winner Showing Textbook Price & Volume Action
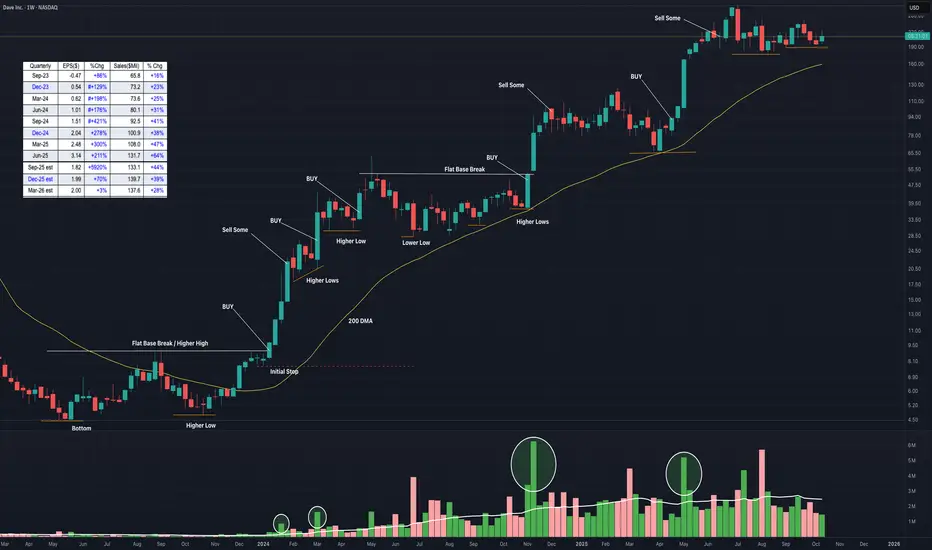
DAVE Inc. (DAVE) has delivered one of the most impressive runs in recent memory — rising over 6,000% from its May 2023 bottom to its July 2025 high.
This weekly chart captures the full CANSLIM progression:
-Flat-base breakout → higher highs → higher lows
-Explosive volume surges on each breakout
-Consolidations and 200-DMA support during corrections
-Textbook chart patterns (flat-base breakout, pennant, high-tight flag, etc.)
-Persistent institutional accumulation visible through volume rhythm
Each breakout aligned with rising earnings, strong sales growth, and expanding fund ownership — the hallmarks of a true market leader.
After a healthy consolidation, DAVE now trades constructively above its 200-day moving average. If the general market resumes its uptrend, this setup could mark the next leg higher in one of the strongest CANSLIM-style moves of this cycle.
DAVE Inc. (
This weekly chart captures the full CANSLIM progression:
-Flat-base breakout → higher highs → higher lows
-Explosive volume surges on each breakout
-Consolidations and 200-DMA support during corrections
-Textbook chart patterns (flat-base breakout, pennant, high-tight flag, etc.)
-Persistent institutional accumulation visible through volume rhythm
Each breakout aligned with rising earnings, strong sales growth, and expanding fund ownership — the hallmarks of a true market leader.
After a healthy consolidation, DAVE now trades constructively above its 200-day moving average. If the general market resumes its uptrend, this setup could mark the next leg higher in one of the strongest CANSLIM-style moves of this cycle.
면책사항
해당 정보와 게시물은 금융, 투자, 트레이딩 또는 기타 유형의 조언이나 권장 사항으로 간주되지 않으며, 트레이딩뷰에서 제공하거나 보증하는 것이 아닙니다. 자세한 내용은 이용 약관을 참조하세요.
면책사항
해당 정보와 게시물은 금융, 투자, 트레이딩 또는 기타 유형의 조언이나 권장 사항으로 간주되지 않으며, 트레이딩뷰에서 제공하거나 보증하는 것이 아닙니다. 자세한 내용은 이용 약관을 참조하세요.