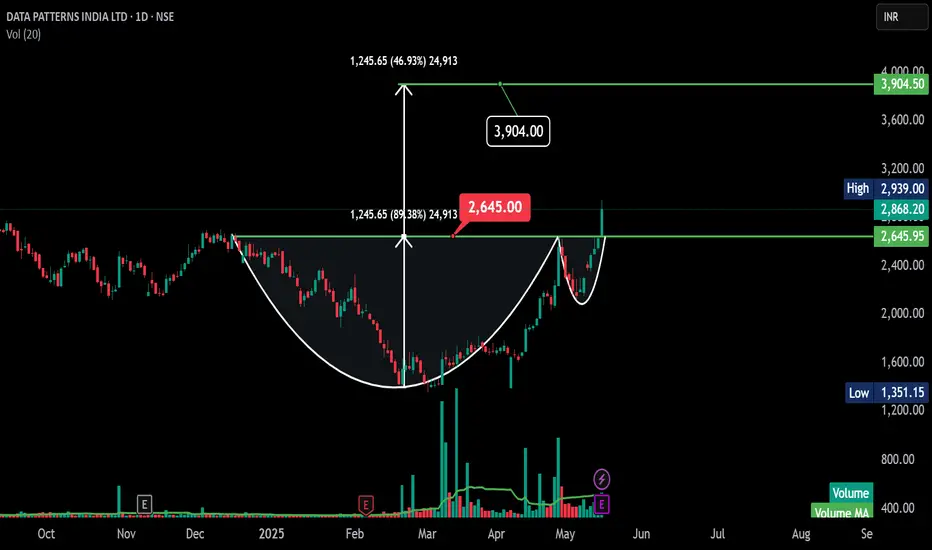
DATA PATTERNS INDIA LTD daily chart.
The most prominent feature here is a well-defined **cup and handle** pattern, which is typically a bullish continuation signal.
Here's a simple breakdown:
* **Cup:** A rounded bottom formation that occurred roughly between early November 2024 and late April 2025. This suggests a period of price consolidation before a potential upward move.
* **Handle:** After reaching a high around ₹2,845.50, the price has pulled back and is consolidating in a smaller, slightly downward-sloping pattern (the handle) between late April and mid-May 2025.
* **Breakout Level:** The horizontal line around ₹2,845.50 acts as the neckline or resistance. A sustained break above this level would confirm the cup and handle pattern.
* **Target:** Potential target around ₹3,904.50. This target is often estimated by measuring the depth of the cup and adding it to the breakout level.
**In simple terms:**
The stock price formed a rounded bottom (the cup), then went up and is now in a smaller pullback (the handle). If it breaks above the ₹2,868 level, it could potentially move towards the ₹3,904 area.
**Things to watch out for:**
* **Breakout Confirmation:** We need to see a clear break above ₹2,868.20 with strong buying volume to confirm the pattern.
* **Handle Formation:** The handle should ideally be a relatively shallow and short-lived consolidation.
* **Volume on Breakout:** Increased volume during the breakout would add more confidence to the bullish scenario.
Overall, the chart for DATA PATTERNS INDIA LTD suggests a bullish outlook based on the cup and handle pattern, with a potential target around ₹3,904.50 upon a successful breakout above ₹2,868.20.
면책사항
해당 정보와 게시물은 금융, 투자, 트레이딩 또는 기타 유형의 조언이나 권장 사항으로 간주되지 않으며, 트레이딩뷰에서 제공하거나 보증하는 것이 아닙니다. 자세한 내용은 이용 약관을 참조하세요.
면책사항
해당 정보와 게시물은 금융, 투자, 트레이딩 또는 기타 유형의 조언이나 권장 사항으로 간주되지 않으며, 트레이딩뷰에서 제공하거나 보증하는 것이 아닙니다. 자세한 내용은 이용 약관을 참조하세요.