Even though the rate of DASH has increased by 0.5% over the day, the general picture remains bearish.
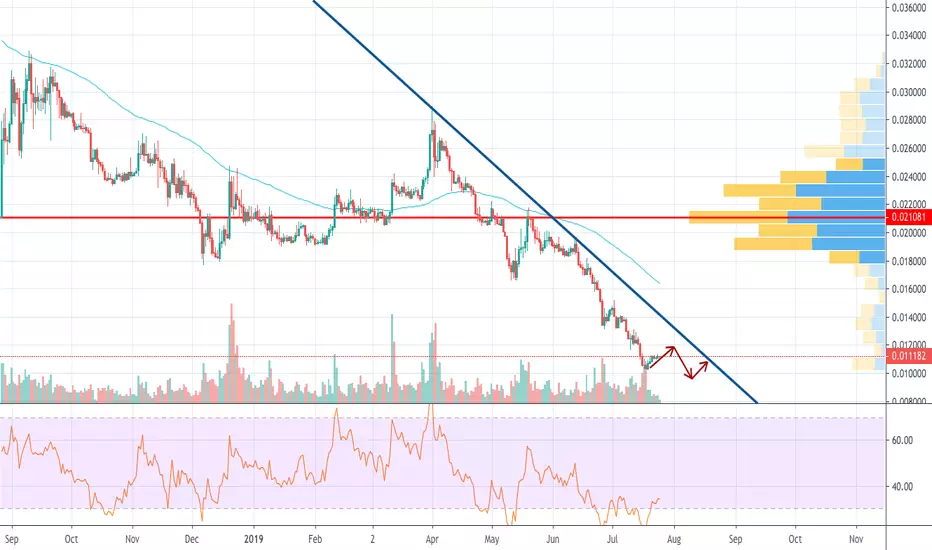
According to the chart, DASH has been declining since April 1, and there are no signals of a possible reversal. The RSI indicator is located near the oversold area, however, DASH is going to strike neither in the short no in the long-term scenario. Overall, the price is likely to fluctuate with a further drop to the area of 0.01 BTC.
According to the chart, DASH has been declining since April 1, and there are no signals of a possible reversal. The RSI indicator is located near the oversold area, however, DASH is going to strike neither in the short no in the long-term scenario. Overall, the price is likely to fluctuate with a further drop to the area of 0.01 BTC.
면책사항
이 정보와 게시물은 TradingView에서 제공하거나 보증하는 금융, 투자, 거래 또는 기타 유형의 조언이나 권고 사항을 의미하거나 구성하지 않습니다. 자세한 내용은 이용 약관을 참고하세요.
면책사항
이 정보와 게시물은 TradingView에서 제공하거나 보증하는 금융, 투자, 거래 또는 기타 유형의 조언이나 권고 사항을 의미하거나 구성하지 않습니다. 자세한 내용은 이용 약관을 참고하세요.