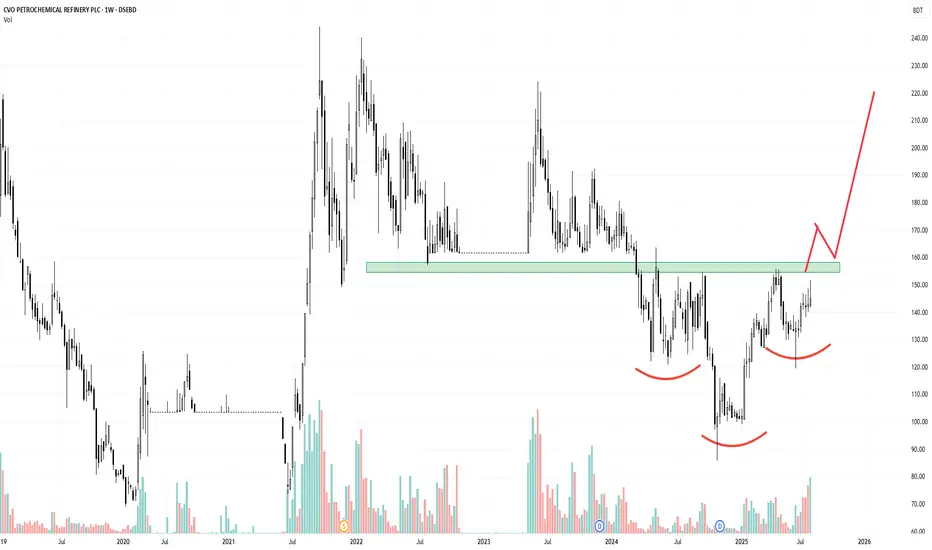
Current Chart Structure in CVOPRL:
CVOPRL has been in a downtrend, but recently it's showing signs of reversal.
The price has formed a clear inverted head and shoulders pattern.
The neckline resistance is currently being tested.
Volume behavior shows early accumulation, which supports a bullish bias.
Momentum indicators (RSI/MACD) are starting to turn positive, suggesting bullish divergence with price.
Trading Plan & Strategy:
Don’t jump in early. Wait for confirmation.
What to watch for:
Breakout above the neckline with convincing volume.
Retest of the neckline support (previous resistance).
Bullish candle formation (like a hammer, bullish engulfing) during retest.
Entry Point: After a breakout and successful retest confirmation.
면책사항
이 정보와 게시물은 TradingView에서 제공하거나 보증하는 금융, 투자, 거래 또는 기타 유형의 조언이나 권고 사항을 의미하거나 구성하지 않습니다. 자세한 내용은 이용 약관을 참고하세요.
면책사항
이 정보와 게시물은 TradingView에서 제공하거나 보증하는 금융, 투자, 거래 또는 기타 유형의 조언이나 권고 사항을 의미하거나 구성하지 않습니다. 자세한 내용은 이용 약관을 참고하세요.