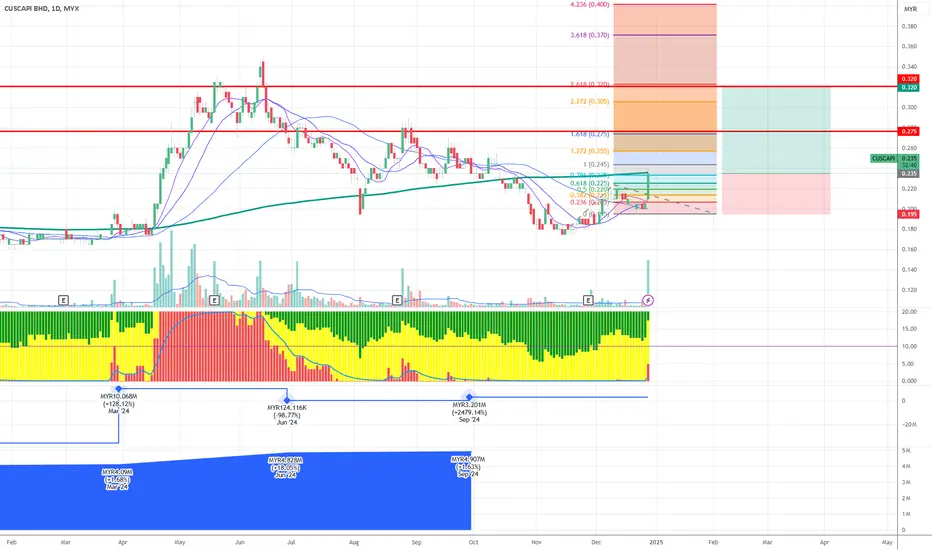
Historical Movement
The stock saw a major peak around 0.370 (marked at 3.618 level)
Experienced a significant downtrend from June to September 2024
Currently showing potential consolidation and base formation
Key Technical Levels:
Resistance Levels:
Major resistance at 0.275 (marked in red)
Secondary resistance at 0.245
Currently testing intermediate resistance around 0.225-0.230
Support Levels:
Strong support at 0.180
Immediate support trend line (green) acting as dynamic support
Price has formed a higher low pattern recently
Technical Indicators:
Moving Averages:
Multiple MAs show potential crossover points
Price is currently testing the shorter-term MAs from below
The longer-term MA (likely 200-day) is still trending downward
Volume Analysis:
Recent volume spike shows increasing interest
Volume generally higher during downtrends
Current consolidation showing reduced volume, typical of base formation
Trading Setup (Current):
Risk Management:
Stop Loss: 0.040 (17.02% risk)
Target: 0.085 (36.17% potential reward)
Risk/Reward ratio: 2.13 (favorable)
Chart Pattern:
Appears to be forming a potential inverse head and shoulders pattern
Neckline resistance around 0.225-0.230
Volume pattern supporting the potential reversal setup
Market Structure:
Shows signs of transitioning from downtrend to potential bottoming phase
Multiple support levels being established
Fibonacci retracement levels marking key resistance zones
면책사항
해당 정보와 게시물은 금융, 투자, 트레이딩 또는 기타 유형의 조언이나 권장 사항으로 간주되지 않으며, 트레이딩뷰에서 제공하거나 보증하는 것이 아닙니다. 자세한 내용은 이용 약관을 참조하세요.
면책사항
해당 정보와 게시물은 금융, 투자, 트레이딩 또는 기타 유형의 조언이나 권장 사항으로 간주되지 않으며, 트레이딩뷰에서 제공하거나 보증하는 것이 아닙니다. 자세한 내용은 이용 약관을 참조하세요.