Cisco (CSCO) Stock Analysis
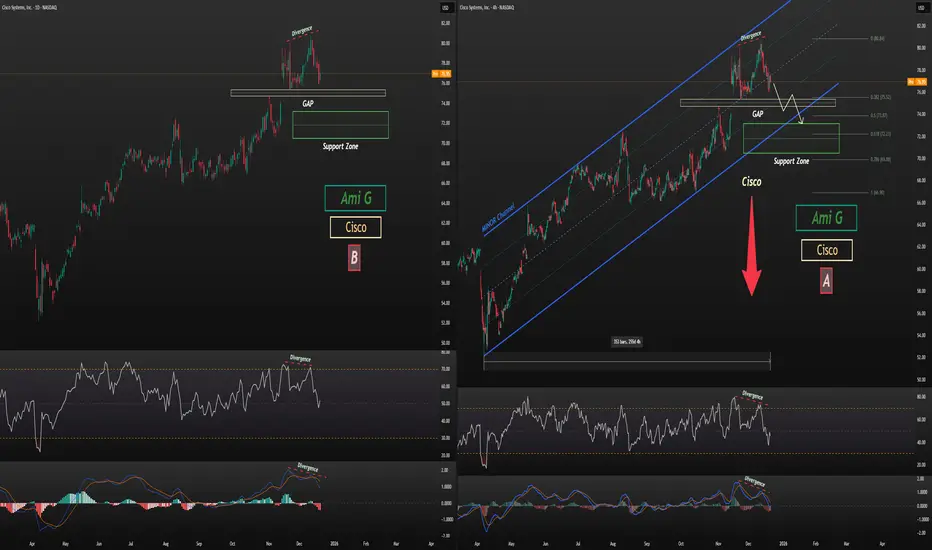
As shown on the chart, Cisco is trading near the upper boundary of its 9-month channel. After forming two strong divergences on the 4H chart (Chart A) and the daily chart (Chart B)—confirmed by both MACD and RSI—the stock has entered a corrective phase.
Given the presence of a very strong gap marked on the chart, price is likely to correct at least toward the gap zone, and potentially extend further to the support zone, which may also align with the lower boundary of the 9-month channel.
Analysis will be updated.
Follow me on TradingView for more analyses and live stock trades.
 CSCO
CSCO
As shown on the chart, Cisco is trading near the upper boundary of its 9-month channel. After forming two strong divergences on the 4H chart (Chart A) and the daily chart (Chart B)—confirmed by both MACD and RSI—the stock has entered a corrective phase.
Given the presence of a very strong gap marked on the chart, price is likely to correct at least toward the gap zone, and potentially extend further to the support zone, which may also align with the lower boundary of the 9-month channel.
Analysis will be updated.
Follow me on TradingView for more analyses and live stock trades.
AG-Precision-Trading
📈 Live Trading: Stocks & Crypto
🔍 Symbol Analysis & Insights
💎 Understanding Relative Asset Values
📈 Live Trading: Stocks & Crypto
🔍 Symbol Analysis & Insights
💎 Understanding Relative Asset Values
면책사항
해당 정보와 게시물은 금융, 투자, 트레이딩 또는 기타 유형의 조언이나 권장 사항으로 간주되지 않으며, 트레이딩뷰에서 제공하거나 보증하는 것이 아닙니다. 자세한 내용은 이용 약관을 참조하세요.