Can Bulls Reclaim $145 or Is the Rally Fading? ⚠️
🟩 Daily Timeframe – Macro Structure and Momentum
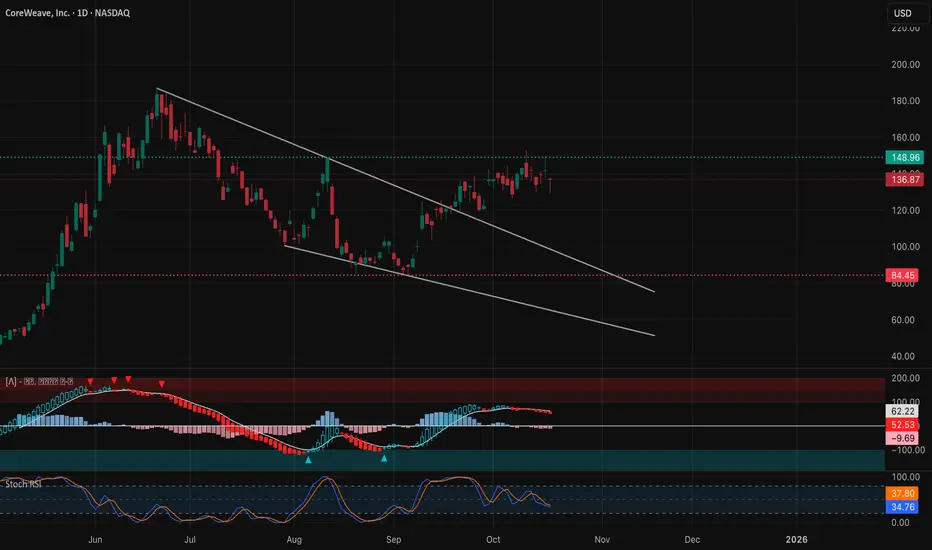
CoreWeave’s daily structure shows a clear descending channel since June, with a recent breakout attempt that stalled near $148–$150. After that local top, price retraced back into the mid-range near $136–$138, where buyers are trying to defend short-term structure.
This region is key — a retest of broken resistance now acting as support. A successful hold here would keep the bullish reversal thesis alive. However, failure to defend $134 risks a deeper drop back toward the mid-channel base near $120.
Technically:
* MACD shows fading bullish momentum with histogram turning light red.
* Stoch RSI cooled from overbought and now sits near 35–40, suggesting potential for one more reset before any next leg higher.
* The pattern still favors a bullish continuation if price stays above $134–$136.
Critical zones:
* Support: $130 → $134
* Resistance: $148.9 → $155
🟦 1-Hour Timeframe – Short-Term Price Action

On the 1-hour view, CRWV is fluctuating inside a tight horizontal range ($130–$145) with alternating CHoCH and BOS patterns — showing equal participation between bulls and bears.
Key takeaways:
* The last BOS occurred near $136, suggesting intraday structure recovery.
* Price has since been capped at the $141.7 supply zone, aligning with liquidity rejection from previous sessions.
* MACD is trying to curl back up after bottoming, while Stoch RSI remains in early recovery.
Short-term, a clean breakout above $141.7–$142.5 can attract momentum traders targeting $147–$150, while failure at that zone reopens the downside toward $130.3 (previous BOS retest).
Watch closely how price reacts between $136.5 and $141.7 — that’s the intraday battleground for control.
🟨 15-Minute Timeframe – Intraday Liquidity Rotation

The 15-minute chart reveals a micro descending wedge forming after several CHoCH–BOS sequences, showing a compressed structure between $129–$141.
Price printed a BOS at $136, followed by a minor CHoCH, meaning bulls are testing control but losing momentum into Friday’s close. The short-term pattern likely plays out with a liquidity sweep below $134–$135, then a quick reversal if buyers absorb it.
Indicators:
* MACD shows mild bullish divergence — histogram rising while price holds flat.
* Stoch RSI resetting near oversold, suggesting possible relief bounce ahead.
If price reclaims $137–$138, expect short-term scalps toward $141.7, while loss of $134 exposes $130.3–$127 zone.
🟥 GEX (Gamma Exposure) & Options Sentiment

The GEX map shows how dealers are positioned:
* Highest call resistance (positive GEX): $145–$153
* Highest put support (negative GEX): $129–$120
* Neutral gamma band: $134–$140 — where most hedging flow stabilizes.
* Max Pain: Around $135, suggesting pinning potential early week.
Dealer flows currently neutral to slightly long gamma, which implies controlled volatility and mean reversion bias early week. A break over $145 could flip gamma short — triggering a momentum extension toward $150–$155 if volume confirms.
Implied Volatility Readings:
* IVR: 37.5
* IVX avg: 34
* Current IV slightly elevated but not extreme — moderate volatility pricing, meaning breakout potential is intact.
🎯 Trade Scenarios
Bullish Setup 🟢
* Entry: Above $141.8–$142.5 confirmation breakout
* Targets: $147 → $150 → $153
* Stop: Below $135.5
* Confluence: MACD bullish crossover + RSI > 55
Bearish Setup 🔴
* Entry: Breakdown under $134.5 or rejection from $141.7
* Targets: $130 → $125
* Stop: Above $142.5
* Confluence: MACD turning red + lower EMA slope
🧭 Closing Outlook – Week of Oct 21–25
CRWV is at a technical inflection zone, coiling just below a key resistance while testing reclaimed trendline support. This structure usually leads to a volatility expansion week.
If bulls defend $134–$136, expect a rebound attempt toward $145+. A failure there shifts control back to sellers, dragging price toward $127–$130 where larger gamma support sits.
With balanced options flow and fading volume, patience is key — wait for clean breakouts or liquidity sweeps before entry.
Disclaimer: This analysis is for educational purposes only and does not constitute financial advice. Always do your own research and manage your risk.
🟩 Daily Timeframe – Macro Structure and Momentum
CoreWeave’s daily structure shows a clear descending channel since June, with a recent breakout attempt that stalled near $148–$150. After that local top, price retraced back into the mid-range near $136–$138, where buyers are trying to defend short-term structure.
This region is key — a retest of broken resistance now acting as support. A successful hold here would keep the bullish reversal thesis alive. However, failure to defend $134 risks a deeper drop back toward the mid-channel base near $120.
Technically:
* MACD shows fading bullish momentum with histogram turning light red.
* Stoch RSI cooled from overbought and now sits near 35–40, suggesting potential for one more reset before any next leg higher.
* The pattern still favors a bullish continuation if price stays above $134–$136.
Critical zones:
* Support: $130 → $134
* Resistance: $148.9 → $155
🟦 1-Hour Timeframe – Short-Term Price Action
On the 1-hour view, CRWV is fluctuating inside a tight horizontal range ($130–$145) with alternating CHoCH and BOS patterns — showing equal participation between bulls and bears.
Key takeaways:
* The last BOS occurred near $136, suggesting intraday structure recovery.
* Price has since been capped at the $141.7 supply zone, aligning with liquidity rejection from previous sessions.
* MACD is trying to curl back up after bottoming, while Stoch RSI remains in early recovery.
Short-term, a clean breakout above $141.7–$142.5 can attract momentum traders targeting $147–$150, while failure at that zone reopens the downside toward $130.3 (previous BOS retest).
Watch closely how price reacts between $136.5 and $141.7 — that’s the intraday battleground for control.
🟨 15-Minute Timeframe – Intraday Liquidity Rotation
The 15-minute chart reveals a micro descending wedge forming after several CHoCH–BOS sequences, showing a compressed structure between $129–$141.
Price printed a BOS at $136, followed by a minor CHoCH, meaning bulls are testing control but losing momentum into Friday’s close. The short-term pattern likely plays out with a liquidity sweep below $134–$135, then a quick reversal if buyers absorb it.
Indicators:
* MACD shows mild bullish divergence — histogram rising while price holds flat.
* Stoch RSI resetting near oversold, suggesting possible relief bounce ahead.
If price reclaims $137–$138, expect short-term scalps toward $141.7, while loss of $134 exposes $130.3–$127 zone.
🟥 GEX (Gamma Exposure) & Options Sentiment
The GEX map shows how dealers are positioned:
* Highest call resistance (positive GEX): $145–$153
* Highest put support (negative GEX): $129–$120
* Neutral gamma band: $134–$140 — where most hedging flow stabilizes.
* Max Pain: Around $135, suggesting pinning potential early week.
Dealer flows currently neutral to slightly long gamma, which implies controlled volatility and mean reversion bias early week. A break over $145 could flip gamma short — triggering a momentum extension toward $150–$155 if volume confirms.
Implied Volatility Readings:
* IVR: 37.5
* IVX avg: 34
* Current IV slightly elevated but not extreme — moderate volatility pricing, meaning breakout potential is intact.
🎯 Trade Scenarios
Bullish Setup 🟢
* Entry: Above $141.8–$142.5 confirmation breakout
* Targets: $147 → $150 → $153
* Stop: Below $135.5
* Confluence: MACD bullish crossover + RSI > 55
Bearish Setup 🔴
* Entry: Breakdown under $134.5 or rejection from $141.7
* Targets: $130 → $125
* Stop: Above $142.5
* Confluence: MACD turning red + lower EMA slope
🧭 Closing Outlook – Week of Oct 21–25
CRWV is at a technical inflection zone, coiling just below a key resistance while testing reclaimed trendline support. This structure usually leads to a volatility expansion week.
If bulls defend $134–$136, expect a rebound attempt toward $145+. A failure there shifts control back to sellers, dragging price toward $127–$130 where larger gamma support sits.
With balanced options flow and fading volume, patience is key — wait for clean breakouts or liquidity sweeps before entry.
Disclaimer: This analysis is for educational purposes only and does not constitute financial advice. Always do your own research and manage your risk.
액티브 트레이드
Quick update for CRVW (CoreWeave) based on your 1-hour chart: Oct. 23🧭 Market Structure
CRVW is still trading within a short-term corrective phase after multiple BOS (Break of Structure) signals confirmed a shift in trend. The last CHoCH indicates an early sign of bullish intent, but price remains below the 9/21 EMA cluster — suggesting resistance is still active until a clean breakout above the 124–126 zone.
⚙️ Indicator Insights
* MACD: Histogram flipped toward the positive side with rising momentum; blue bars showing bullish convergence, but still below the zero line — meaning this recovery is still in its early stage.
* Stoch RSI: Maxed out near 99/92, signaling an overbought condition on this timeframe — expect possible cooling or sideways consolidation before continuation.
🧱 Key Levels
* Immediate Support: 121.80 → 120.10
* Short-term Resistance: 124.00 → 126.00 (EMA + fib zone)
* Major Resistance Above: 132.00 (Fib 50%) and 139.00 (next key supply)
* Downside Target if Rejected: 117.00 → 114.00 → potential liquidity sweep toward 105.00 if momentum fails.
💡 Trade Thought
The small “Buy” signal from your system aligns with the short-term relief bounce, but the structure suggests a possible lower-high forming unless price reclaims 126+.
* A break and hold above 126 would confirm the reversal toward 132+.
* If price rejects at EMA cluster and falls below 120.8 again → expect renewed downside continuation.
🎯 Watch For
* Bullish confirmation: candle close above 126 with volume pickup.
* Bearish rejection: failure at EMA cluster with MACD flattening.
* Stoch RSI reset below 50 before the next leg gives cleaner long entries.
면책사항
해당 정보와 게시물은 금융, 투자, 트레이딩 또는 기타 유형의 조언이나 권장 사항으로 간주되지 않으며, 트레이딩뷰에서 제공하거나 보증하는 것이 아닙니다. 자세한 내용은 이용 약관을 참조하세요.
면책사항
해당 정보와 게시물은 금융, 투자, 트레이딩 또는 기타 유형의 조언이나 권장 사항으로 간주되지 않으며, 트레이딩뷰에서 제공하거나 보증하는 것이 아닙니다. 자세한 내용은 이용 약관을 참조하세요.