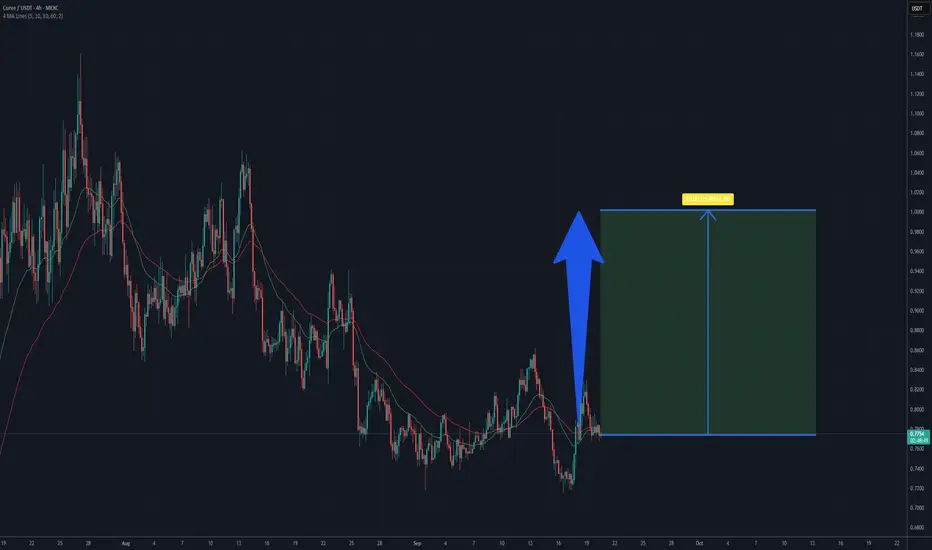
On the 4-hour Curve/USDT chart the market shows a period of sideways consolidation after a recent rebound from the 0.72 USD area. Price is hovering around 0.77 USD, moving in a relatively tight range and testing both short-term moving averages.
The shorter moving average has started to flatten and occasionally crosses above the longer one, a sign that selling momentum is easing. At the same time, the longer moving average still trends slightly downward, so the broader picture remains neutral to mildly bearish until a clear break higher occurs.
A key support zone is visible around 0.74–0.75 USD, where several pullbacks have recently been absorbed. Above current levels, the first notable resistance lies near 0.80 USD, followed by a wider supply zone around 0.86–0.88 USD that previously capped upward moves. A sustained close above those levels, especially with rising trading volume, would indicate strengthening bullish pressure.
Overall, the chart reflects a market that is stabilizing after a decline, with early signs that buyers are trying to build momentum. Further confirmation from price closing above the identified resistance areas and a continued uptick in volume would improve the outlook for additional upward movement.
Potential TP: 1 $
면책사항
해당 정보와 게시물은 금융, 투자, 트레이딩 또는 기타 유형의 조언이나 권장 사항으로 간주되지 않으며, 트레이딩뷰에서 제공하거나 보증하는 것이 아닙니다. 자세한 내용은 이용 약관을 참조하세요.
면책사항
해당 정보와 게시물은 금융, 투자, 트레이딩 또는 기타 유형의 조언이나 권장 사항으로 간주되지 않으며, 트레이딩뷰에서 제공하거나 보증하는 것이 아닙니다. 자세한 내용은 이용 약관을 참조하세요.