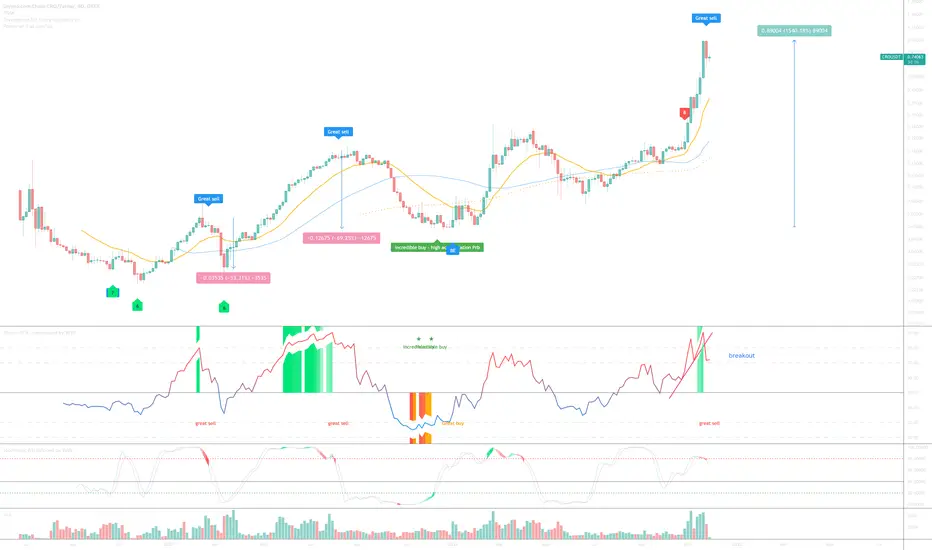
On the above 4-day dollar chart a ‘great sell’ alert prints following a 1500% appreciation in price action from the ‘incredible buy’ signal. Look left, those signals on this time scale are typically followed by significant corrections. 50 and 70% at last signal, respectively. Latterly on the 1-day CRO / BTC chart (below) a ‘incredible sell’ signal prints.
Surprisingly many many tradingview.com ideas are currently ‘long’, don’t be herd.
Is it possible price action continues to move higher? Sure.
Is it probable? Very unlikely.
Good luck!
WW
Don’t be shy, you can use the tip addresses, they really do work.
1-day CRO / BTC chart

Surprisingly many many tradingview.com ideas are currently ‘long’, don’t be herd.
Is it possible price action continues to move higher? Sure.
Is it probable? Very unlikely.
Good luck!
WW
Don’t be shy, you can use the tip addresses, they really do work.
1-day CRO / BTC chart
액티브 트레이드
노트
The sell signal was confirmed, now down 35%. Look for support around 30 cents (the orange line).매매 수동청산
노트
Some folks asking me if it is safe to go long again. No is the short answer.Yes, there's a 'great buy' signal, but I don't think it will amount to anything more than a relief rally to the 50-day SMA, currently around 54 cents . The head and shoulders pattern remains in play with a 28-30 cent target.
The trend is printing lower highs lower lows, you can't go long into that.
Be patient.
매매 수동청산
면책사항
해당 정보와 게시물은 금융, 투자, 트레이딩 또는 기타 유형의 조언이나 권장 사항으로 간주되지 않으며, 트레이딩뷰에서 제공하거나 보증하는 것이 아닙니다. 자세한 내용은 이용 약관을 참조하세요.
면책사항
해당 정보와 게시물은 금융, 투자, 트레이딩 또는 기타 유형의 조언이나 권장 사항으로 간주되지 않으며, 트레이딩뷰에서 제공하거나 보증하는 것이 아닙니다. 자세한 내용은 이용 약관을 참조하세요.