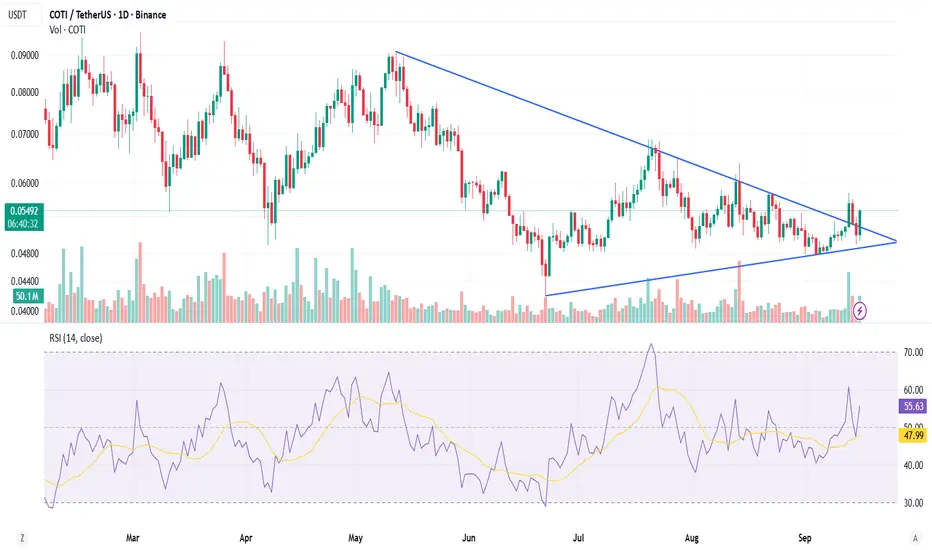
COTI has been consolidating inside a symmetrical triangle for several months, with lower highs and higher lows squeezing the price action.
🔎 Key Observations
Price has now broken out of the triangle resistance with a strong green daily candle.
Volume increased significantly on the breakout, confirming buyer participation.
RSI (14) is at 55.9, trending upward and above the neutral 50 mark, showing improving momentum.
Price is currently trading at $0.0551, above the key breakout zone around $0.052 – $0.053.
📊 Bullish Scenario
Holding above $0.052 keeps the breakout valid.
First resistance: $0.060
Next resistance: $0.070 (major psychological level).
Break and close above $0.070 could open the path toward $0.080 – $0.090.
⚠️ Bearish Scenario
If price falls back below $0.052, it may re-enter the triangle range.
Key supports:
$0.050 – $0.048
$0.045 (triangle base and crucial support)
A breakdown below $0.045 would invalidate the bullish setup.
면책사항
이 정보와 게시물은 TradingView에서 제공하거나 보증하는 금융, 투자, 거래 또는 기타 유형의 조언이나 권고 사항을 의미하거나 구성하지 않습니다. 자세한 내용은 이용 약관을 참고하세요.
면책사항
이 정보와 게시물은 TradingView에서 제공하거나 보증하는 금융, 투자, 거래 또는 기타 유형의 조언이나 권고 사항을 의미하거나 구성하지 않습니다. 자세한 내용은 이용 약관을 참고하세요.