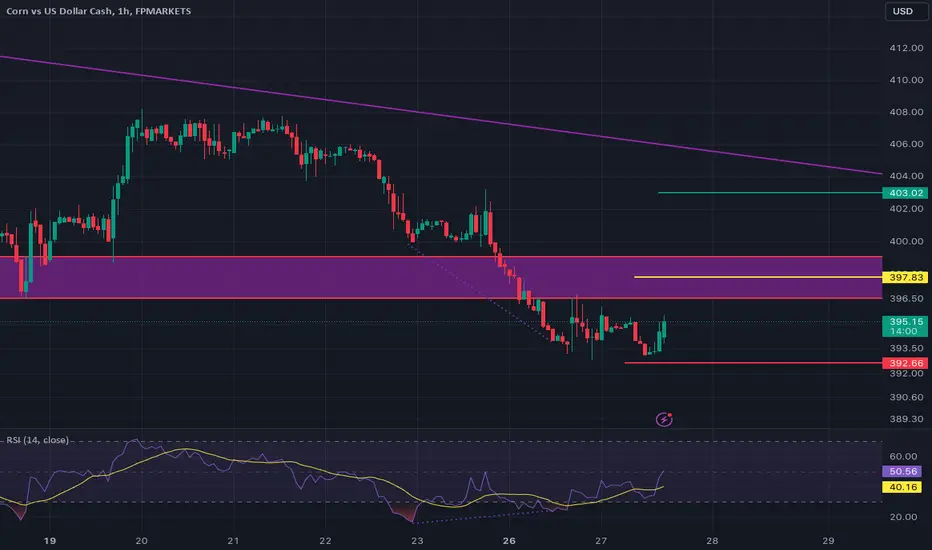
Corn analysis is done on an hourly chart. There is a bullish divergence on an hourly chart with a formation of double bottom reversal pattern. Placed an entry on the previous LH with SL placed just below the double bottom.
The Signal is:
EP: 397.83
SL: 392.66
TP: 403.00
The Signal is:
EP: 397.83
SL: 392.66
TP: 403.00
면책사항
이 정보와 게시물은 TradingView에서 제공하거나 보증하는 금융, 투자, 거래 또는 기타 유형의 조언이나 권고 사항을 의미하거나 구성하지 않습니다. 자세한 내용은 이용 약관을 참고하세요.
면책사항
이 정보와 게시물은 TradingView에서 제공하거나 보증하는 금융, 투자, 거래 또는 기타 유형의 조언이나 권고 사항을 의미하거나 구성하지 않습니다. 자세한 내용은 이용 약관을 참고하세요.