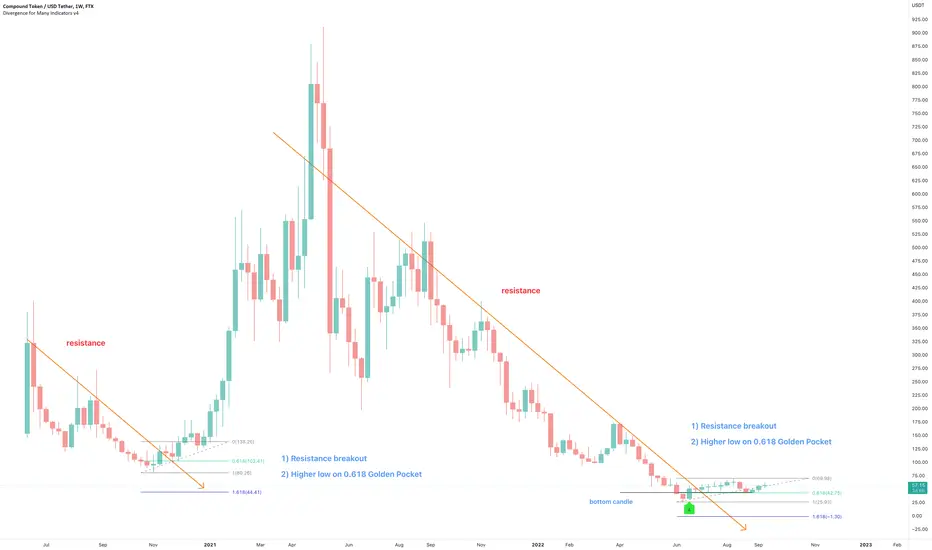
On the above 1-week chart price action has corrected 95% since May 2021. A number of reasons now exist to be bullish, including:
1) A strong buy signal prints (not shown). If you want to see, just ask.
2) Price action, RSI and MFI resistance breakouts.
3) Regular bullish divergence.
4) Everything that was said above is also true for the BTC pair.
5) Price action prints the higher low on the golden pocket following point #2. Look left!
Is it possible price action falls further? Sure.
Is it probable? No.
Ww
Type: trade
Risk: <=6% of portfolio
Timeframe: Don’t know.
Return: $800 / 1400%
Stop loss: None
노트
Do you see the 2-day DOJI candle printing on the 2-day/50-day SMA?? Closes today.액티브 트레이드
Did you see the candle that has printed on the two week chart? Fantastic.What does this candle mean?
youtube.com/watch?v=H3ZBDIsF0is
노트
This is a 2-day chart. The two moving averages shown (on separate time frames) saw a crazy jump in price action once they crossed. A particular give away is the curved bottom.Let's come back to this place in 90 days to see if history repeated itself.
액티브 트레이드
Did you see what printed on the 3-day chart?What happened just at the beginning of this month has not happened since January 7-10th, 2021. Price action roared up 450% after that.
관련 발행물
면책사항
이 정보와 게시물은 TradingView에서 제공하거나 보증하는 금융, 투자, 거래 또는 기타 유형의 조언이나 권고 사항을 의미하거나 구성하지 않습니다. 자세한 내용은 이용 약관을 참고하세요.
관련 발행물
면책사항
이 정보와 게시물은 TradingView에서 제공하거나 보증하는 금융, 투자, 거래 또는 기타 유형의 조언이나 권고 사항을 의미하거나 구성하지 않습니다. 자세한 내용은 이용 약관을 참고하세요.