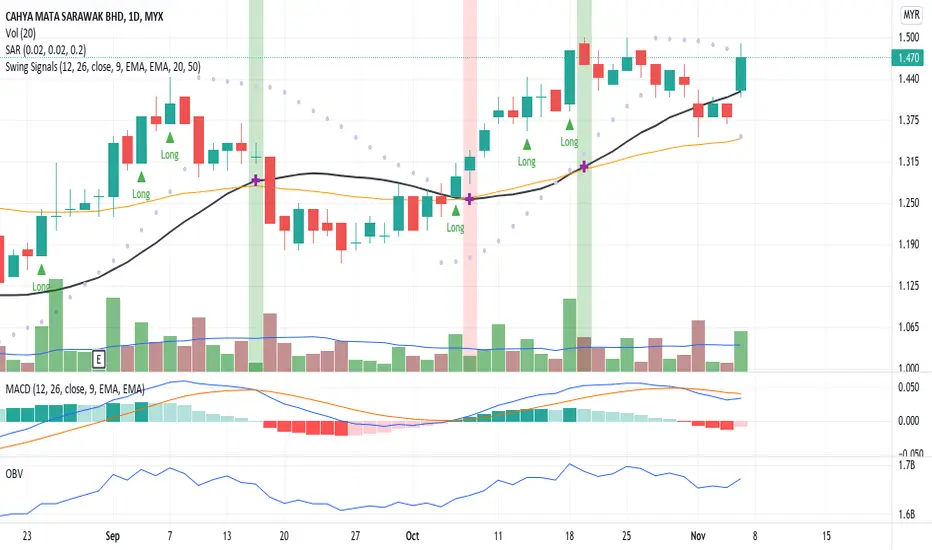
The price candlestick indicates a divergence signal where the price closed above MA20 with volume above MA20. A good sign for a long trade position. OBV chart indicates an uptrend trend. And MACD chart is in the weakness and negative signal. Put CMSB in your WL and watch out for significant price movement with volume or when MACD crosses up the signal line which indicates a positive momentum.
R 1.560
S 1.410
R 1.560
S 1.410
관련 발행물
면책사항
이 정보와 게시물은 TradingView에서 제공하거나 보증하는 금융, 투자, 거래 또는 기타 유형의 조언이나 권고 사항을 의미하거나 구성하지 않습니다. 자세한 내용은 이용 약관을 참고하세요.
면책사항
이 정보와 게시물은 TradingView에서 제공하거나 보증하는 금융, 투자, 거래 또는 기타 유형의 조언이나 권고 사항을 의미하거나 구성하지 않습니다. 자세한 내용은 이용 약관을 참고하세요.