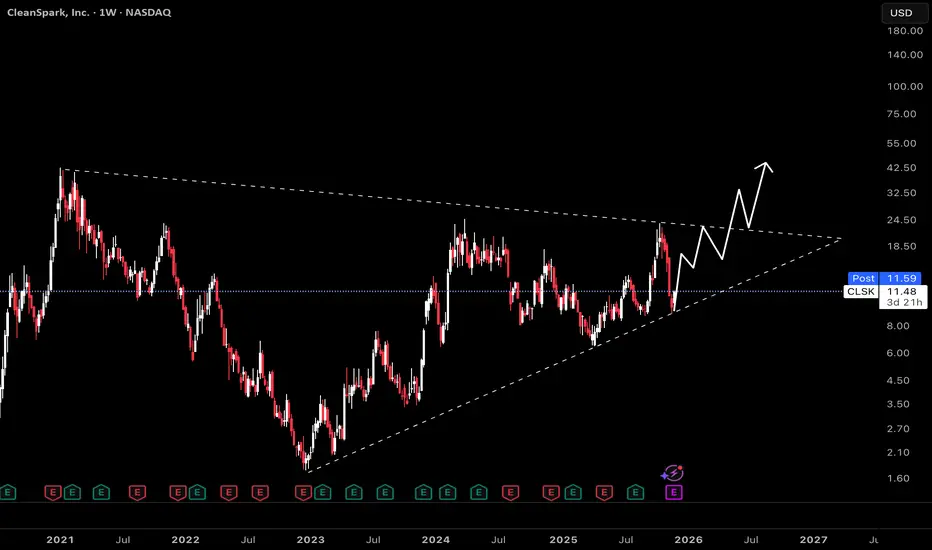
This weekly chart tracks CleanSpark, revealing an extended symmetrical triangle formation that has dictated price action since mid-2021. Symmetrical triangles often signal a period of compression in volatility, building up for a breakout as price coils between support and resistance trendlines.
Triangles like this signal indecision, as neither bulls nor bears have established control. The energy stored within the pattern typically results in a significant move once a breakout occurs.
Given the recent bounce off ascending support and renewed momentum, the most plausible scenario is a bullish breakout.
For a short-term opportunity, the upper resistance of the triangle offers a plausible setup for a countertrend trade. If price rallies toward the triangle's descending resistance and stalls, a short position could be initiated with tight risk management. The idea is to sell CLSK at resistance, anticipating that price may be rejected and revert lower within the triangle until a confirmed breakout occurs.
면책사항
해당 정보와 게시물은 금융, 투자, 트레이딩 또는 기타 유형의 조언이나 권장 사항으로 간주되지 않으며, 트레이딩뷰에서 제공하거나 보증하는 것이 아닙니다. 자세한 내용은 이용 약관을 참조하세요.
면책사항
해당 정보와 게시물은 금융, 투자, 트레이딩 또는 기타 유형의 조언이나 권장 사항으로 간주되지 않으며, 트레이딩뷰에서 제공하거나 보증하는 것이 아닙니다. 자세한 내용은 이용 약관을 참조하세요.