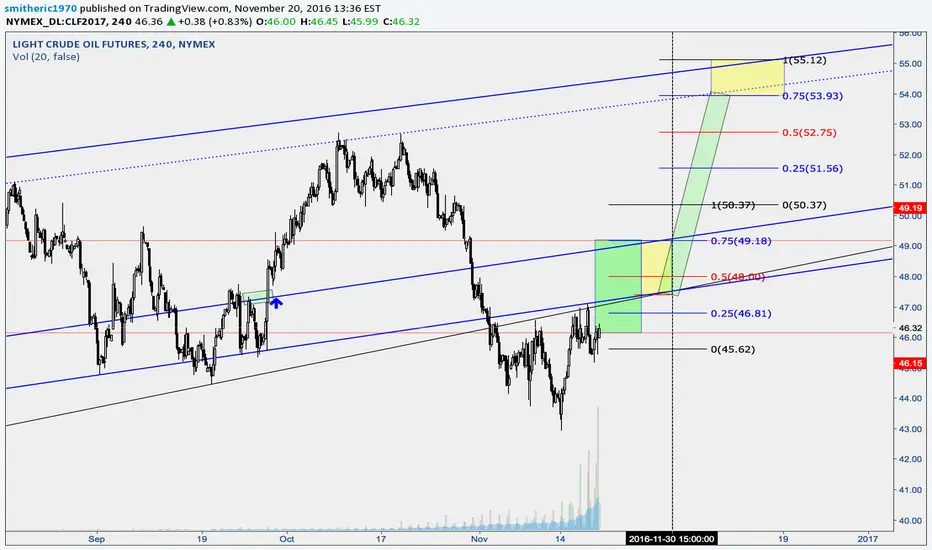
Support chart for my Oil Long into OPEC - Clones chart showing previous channel and price legs.
Blue are channel repeat legs; Red are S/R price based legs showing a potential jump this week and lower black is a pivot. I've included the same daily TR clones as the related chart that includes trading details and if this plays out I'll expect that mid term prices will find 51.75 - 53.93 support.
Good trading all!
관련 발행물
면책사항
이 정보와 게시물은 TradingView에서 제공하거나 보증하는 금융, 투자, 거래 또는 기타 유형의 조언이나 권고 사항을 의미하거나 구성하지 않습니다. 자세한 내용은 이용 약관을 참고하세요.
면책사항
이 정보와 게시물은 TradingView에서 제공하거나 보증하는 금융, 투자, 거래 또는 기타 유형의 조언이나 권고 사항을 의미하거나 구성하지 않습니다. 자세한 내용은 이용 약관을 참고하세요.