The weekly chart of CL shows a divergence of MACD lines and sort of a divergence of the histogram. Both Force Indexes are lower than they were at the last swing high. 
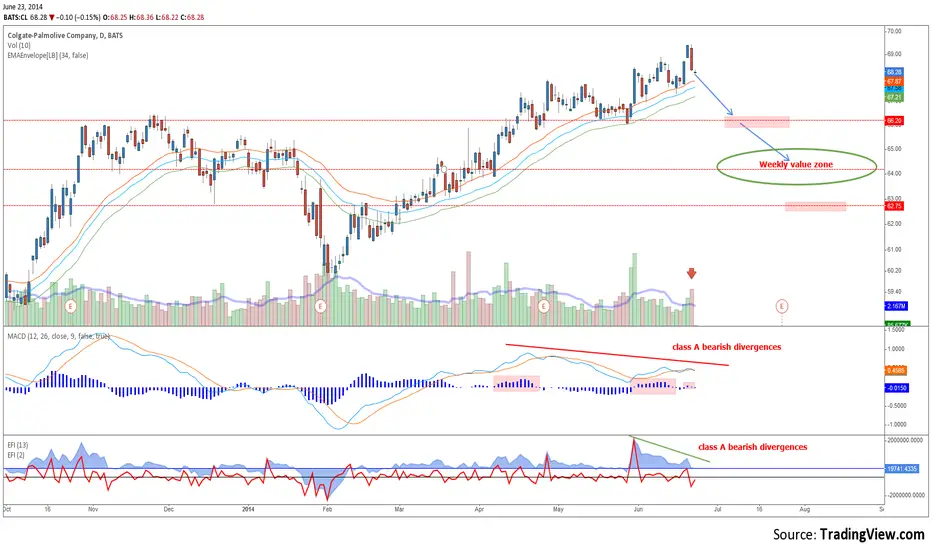
The daily chart has a closing marubozu candle, which might signal the start of the correction, note also the high volume. MACD lines and histogram show a class A bearish divergence, and so do both Force Indexes. First support comes at 66$. There is good support at 64$, where the weekly Wave stands approximately. That will be a level to watch closely if this correction is coming
The daily chart has a closing marubozu candle, which might signal the start of the correction, note also the high volume. MACD lines and histogram show a class A bearish divergence, and so do both Force Indexes. First support comes at 66$. There is good support at 64$, where the weekly Wave stands approximately. That will be a level to watch closely if this correction is coming
면책사항
이 정보와 게시물은 TradingView에서 제공하거나 보증하는 금융, 투자, 거래 또는 기타 유형의 조언이나 권고 사항을 의미하거나 구성하지 않습니다. 자세한 내용은 이용 약관을 참고하세요.
면책사항
이 정보와 게시물은 TradingView에서 제공하거나 보증하는 금융, 투자, 거래 또는 기타 유형의 조언이나 권고 사항을 의미하거나 구성하지 않습니다. 자세한 내용은 이용 약관을 참고하세요.