Short Analysis:
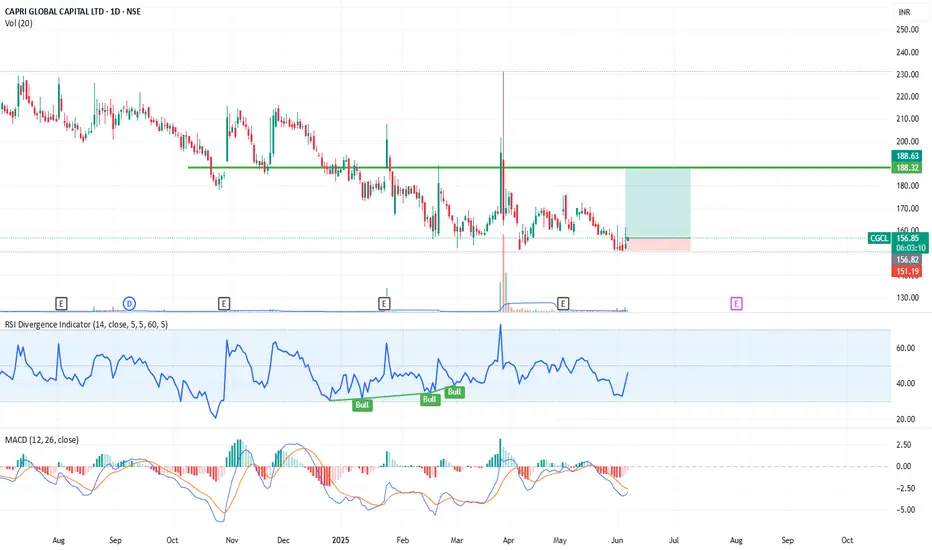
Chart Pattern: The stock is currently trading near a strong horizontal support zone (~₹151–₹155), tested multiple times.
Note: This is not a recommendation, only for study purposes. Do your own analysis and apply proper risk management before making any trading decisions.
Chart Pattern: The stock is currently trading near a strong horizontal support zone (~₹151–₹155), tested multiple times.
- RSI: Shows bullish divergence around 45, indicating potential upward momentum.
- MACD: Close to a bullish crossover, signaling a possible trend reversal.
- Volume: Slight rise in volume supports the current bounce attempt.
- Risk/Reward: Marked risk zone below ₹151.19 and possible target area around ₹188.
Note: This is not a recommendation, only for study purposes. Do your own analysis and apply proper risk management before making any trading decisions.
면책사항
이 정보와 게시물은 TradingView에서 제공하거나 보증하는 금융, 투자, 거래 또는 기타 유형의 조언이나 권고 사항을 의미하거나 구성하지 않습니다. 자세한 내용은 이용 약관을 참고하세요.
면책사항
이 정보와 게시물은 TradingView에서 제공하거나 보증하는 금융, 투자, 거래 또는 기타 유형의 조언이나 권고 사항을 의미하거나 구성하지 않습니다. 자세한 내용은 이용 약관을 참고하세요.