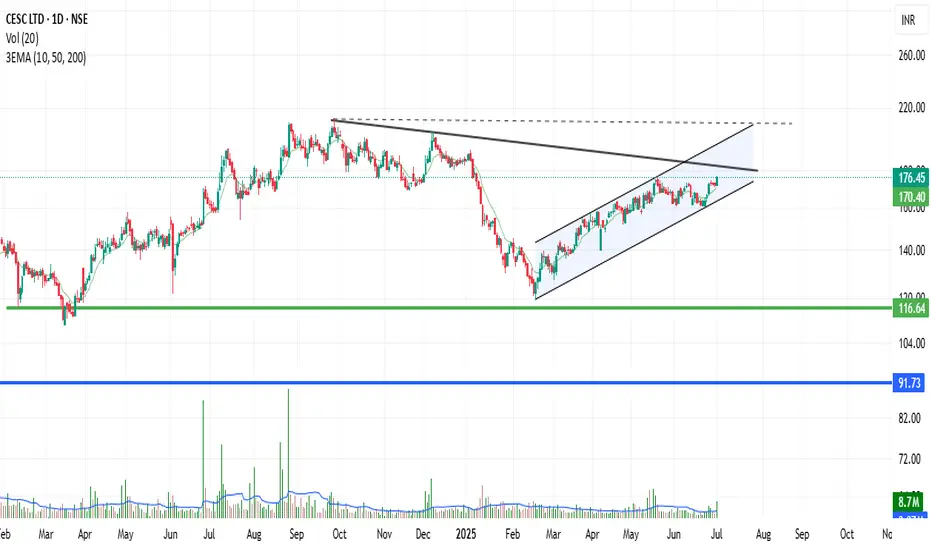
📊 Chart Overview:
Current Price: ₹176.45 (↑ +2.74%)
Price all 3EMA (10, 50, 200) above → Currently around ₹170.40
Volume: Significant recent spike at 8.7M, above 20-day average volume (3.37M)
Trend Pattern: Ascending channel (marked), approaching major resistance zone
Trend & Structure:
Uptrend within a rising channel since March 2025.
The price is near the upper boundary of the rising channel — short-term resistance zone.
There's a falling trend-line resistance from past highs (Sept–Dec 2024), which the price is currently testing.
Support Zones:
Immediate Support: ₹170 (EMA support & lower channel trend line)
Medium-Term Support: ₹116.64 (horizontal green support line)
Strong Long-Term Support: ₹91.73 and ₹72 (horizontal levels)
Resistance Levels:
Immediate Resistance: ₹178–₹180 (upper channel + descending trendline)
Major Resistance Zone: ₹210–₹220 (previous swing highs)
Volume Analysis:
Volume surge on the breakout attempt indicates buyer interest.
Follow-up confirmation candle needed to validate breakout.
✅ Summary & View:
The stock is in a healthy uptrend and attempting to break above a key resistance confluence (channel top + falling trendline).
Sustained move above ₹180 with volume can trigger a bullish breakout toward ₹200–₹220.
Traders should watch for breakout confirmation or possible rejection near the current level.
Ideal entry on pullback near ₹170 with SL below channel for swing traders.
면책사항
이 정보와 게시물은 TradingView에서 제공하거나 보증하는 금융, 투자, 거래 또는 기타 유형의 조언이나 권고 사항을 의미하거나 구성하지 않습니다. 자세한 내용은 이용 약관을 참고하세요.
면책사항
이 정보와 게시물은 TradingView에서 제공하거나 보증하는 금융, 투자, 거래 또는 기타 유형의 조언이나 권고 사항을 의미하거나 구성하지 않습니다. 자세한 내용은 이용 약관을 참고하세요.