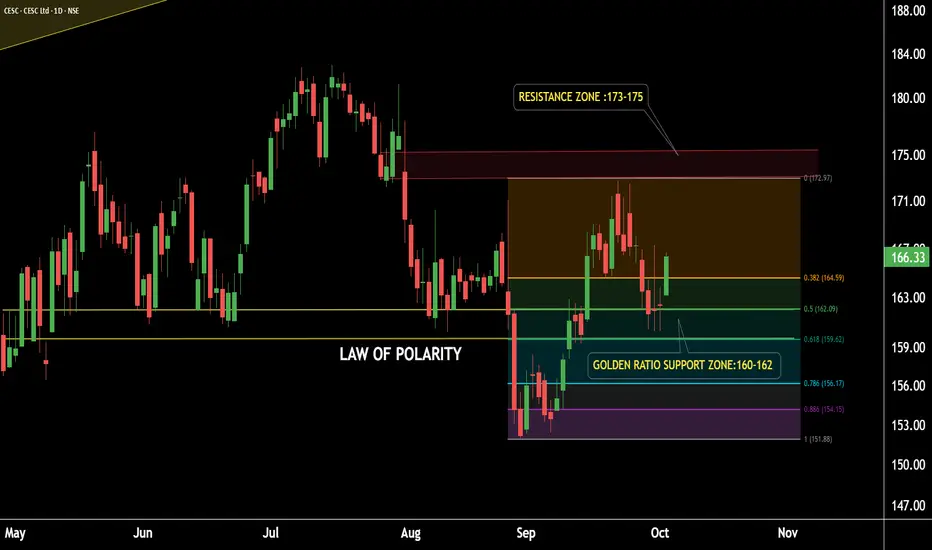
CESC Daily Timeframe Analysis
CESC is sustaining above its Law of Polarity (LOP) after a breakout.
The stock has successfully retested the LOP and is showing strength.
This level also aligns with the Golden Ratio Zone of Fibonacci Retracement, representing a strong support zone around 159–162.
Potential Upside Target: 172–175.
If the support zone sustains, we may see higher prices in CESC.
Thank you!
@RahulSaraoge
Connect us at t.me/stridesadvisory
Connect us at t.me/stridesadvisory
면책사항
해당 정보와 게시물은 금융, 투자, 트레이딩 또는 기타 유형의 조언이나 권장 사항으로 간주되지 않으며, 트레이딩뷰에서 제공하거나 보증하는 것이 아닙니다. 자세한 내용은 이용 약관을 참조하세요.
@RahulSaraoge
Connect us at t.me/stridesadvisory
Connect us at t.me/stridesadvisory
면책사항
해당 정보와 게시물은 금융, 투자, 트레이딩 또는 기타 유형의 조언이나 권장 사항으로 간주되지 않으며, 트레이딩뷰에서 제공하거나 보증하는 것이 아닙니다. 자세한 내용은 이용 약관을 참조하세요.