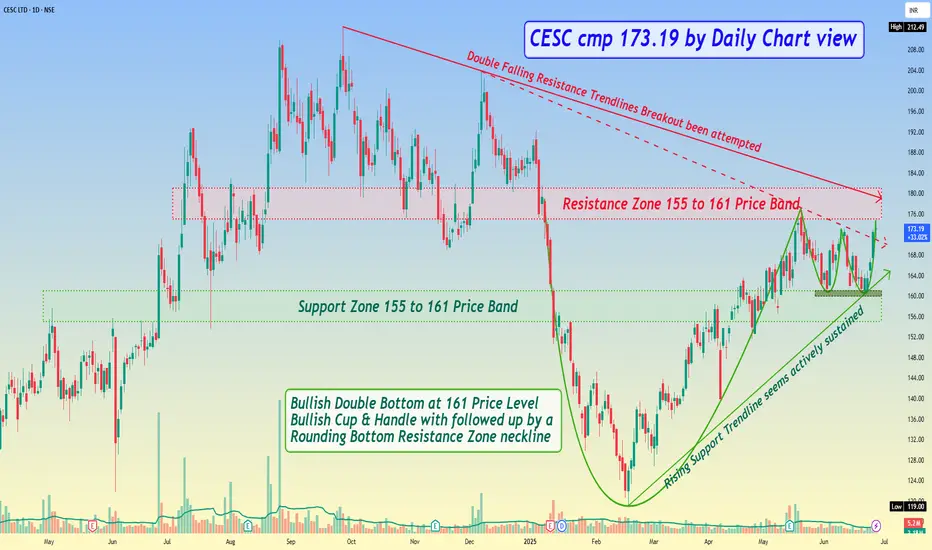
*CESC cmp 173.19 by Daily Chart view*
- Support Zone 155 to 161 Price Band
- Resistance Zone 155 to 161 Price Band
- Bullish Double Bottom at 161 Price Level
- Rising Support Trendline seems actively sustained
- Volumes spiking seen in sync with the avg traded quantity
- Double Falling Resistance Trendlines Breakout been attempted
- Bullish Cup & Handle with followed up by a Rounding Bottom Resistance Zone neckline
관련 발행물
면책사항
해당 정보와 게시물은 금융, 투자, 트레이딩 또는 기타 유형의 조언이나 권장 사항으로 간주되지 않으며, 트레이딩뷰에서 제공하거나 보증하는 것이 아닙니다. 자세한 내용은 이용 약관을 참조하세요.
면책사항
해당 정보와 게시물은 금융, 투자, 트레이딩 또는 기타 유형의 조언이나 권장 사항으로 간주되지 않으며, 트레이딩뷰에서 제공하거나 보증하는 것이 아닙니다. 자세한 내용은 이용 약관을 참조하세요.