Price Levels:
The stock was trading around ₹734.60, slightly down from the previous close of ₹735.60 (–0.14%)
Another snapshot shows ₹736.25 (with a range of ₹731.65 to ₹743.05)
These minor differences reflect changes across different timestamps and data sources—typical for live market quotes.
Daily Technical Indicators:
TradingView indicates a “Strong Sell” for moving averages and an overall “Sell” signal today on a 1-day timeframe
Investing.com mirrors this, also showing a “Strong Sell” on daily technicals
Investing.com India (Investing India) recently noted that on the daily frame, moving averages present a “Strong Buy” outlook (10 Buy vs. 2 Sell signals), but overall the daily technical status is Neutral—Oscillators and indicators were mixed
Moneycontrol's daily technical rating is again Neutral with classic pivot levels suggesting:
Resistance (Classic pivot):
R1: ₹742.90
R2: ₹748.45
R3: ₹754.90
Support:
S1: ₹730.90
S2: ₹724.45
S3: ₹718.90
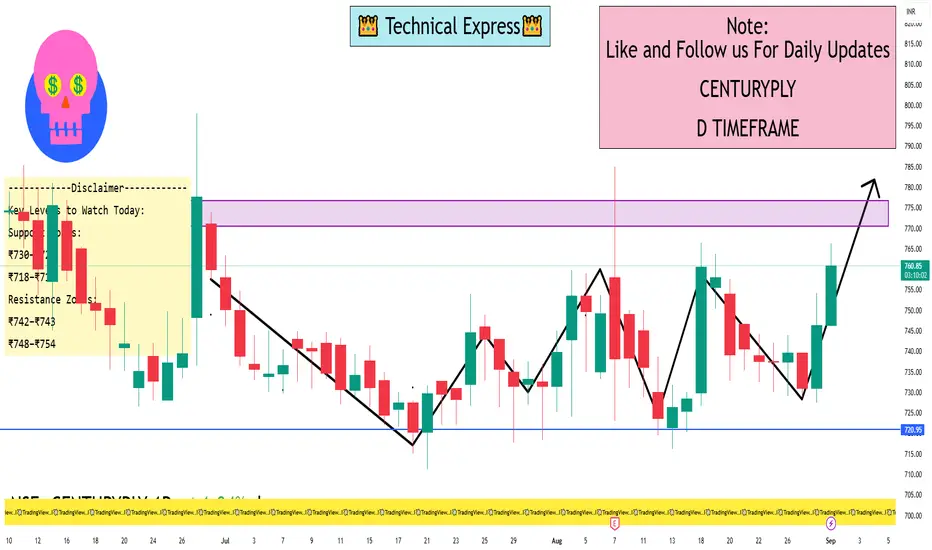
Key Levels to Watch Today:
Support Zones:
₹730–₹724 (key range where buyers may emerge)
₹718–₹719 (lower buffer if weakness continues)
Resistance Zones:
₹742–₹743 (initial cap, also R1 pivot)
₹748–₹754 (secondary resistance levels)
These include pivot points and typical price-level touchpoints for intraday traders
The stock was trading around ₹734.60, slightly down from the previous close of ₹735.60 (–0.14%)
Another snapshot shows ₹736.25 (with a range of ₹731.65 to ₹743.05)
These minor differences reflect changes across different timestamps and data sources—typical for live market quotes.
Daily Technical Indicators:
TradingView indicates a “Strong Sell” for moving averages and an overall “Sell” signal today on a 1-day timeframe
Investing.com mirrors this, also showing a “Strong Sell” on daily technicals
Investing.com India (Investing India) recently noted that on the daily frame, moving averages present a “Strong Buy” outlook (10 Buy vs. 2 Sell signals), but overall the daily technical status is Neutral—Oscillators and indicators were mixed
Moneycontrol's daily technical rating is again Neutral with classic pivot levels suggesting:
Resistance (Classic pivot):
R1: ₹742.90
R2: ₹748.45
R3: ₹754.90
Support:
S1: ₹730.90
S2: ₹724.45
S3: ₹718.90
Key Levels to Watch Today:
Support Zones:
₹730–₹724 (key range where buyers may emerge)
₹718–₹719 (lower buffer if weakness continues)
Resistance Zones:
₹742–₹743 (initial cap, also R1 pivot)
₹748–₹754 (secondary resistance levels)
These include pivot points and typical price-level touchpoints for intraday traders
I built a Buy & Sell Signal Indicator with 85% accuracy.
📈 Get access via DM or
WhatsApp: wa.link/d997q0
| Email: techncialexpress@gmail.com
| Script Coder | Trader | Investor | From India
📈 Get access via DM or
WhatsApp: wa.link/d997q0
| Email: techncialexpress@gmail.com
| Script Coder | Trader | Investor | From India
관련 발행물
면책사항
이 정보와 게시물은 TradingView에서 제공하거나 보증하는 금융, 투자, 거래 또는 기타 유형의 조언이나 권고 사항을 의미하거나 구성하지 않습니다. 자세한 내용은 이용 약관을 참고하세요.