CELG forms 3 weeks tight
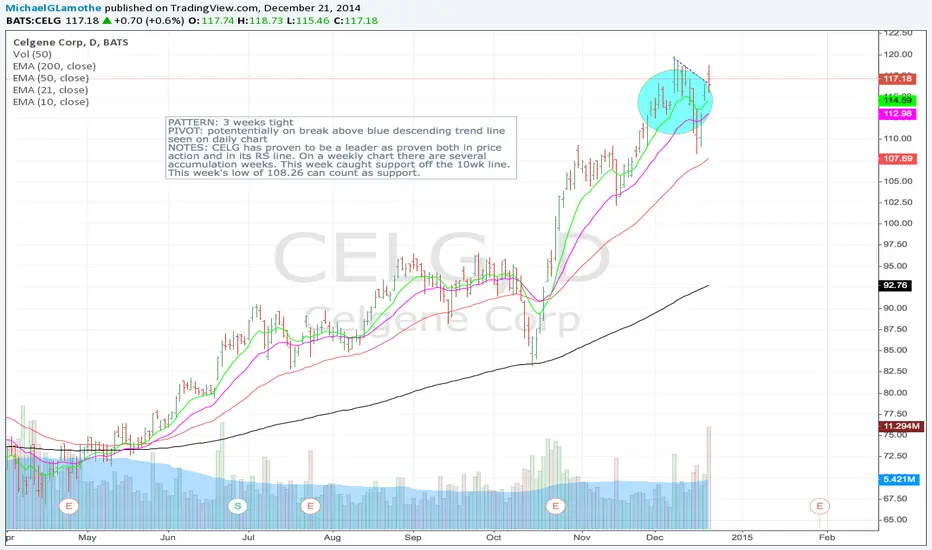
PATTERN: 3 weeks tight
PIVOT: potententially on break above blue descending trend line seen on daily chart
NOTES: CELG has proven to be a leader as proven both in price action and in its RS line. On a weekly chart there are several accumulation weeks. This week caught support off the 10wk line. This week's low of 108.26 can count as support.
면책사항
이 정보와 게시물은 TradingView에서 제공하거나 보증하는 금융, 투자, 거래 또는 기타 유형의 조언이나 권고 사항을 의미하거나 구성하지 않습니다. 자세한 내용은 이용 약관을 참고하세요.
면책사항
이 정보와 게시물은 TradingView에서 제공하거나 보증하는 금융, 투자, 거래 또는 기타 유형의 조언이나 권고 사항을 의미하거나 구성하지 않습니다. 자세한 내용은 이용 약관을 참고하세요.