Ceat announced its quarterly results on 29.4.2025 and the market gave big thumbsup to its numbers making the stock price surge up to 8% to Rs.3300 at the time of writing.
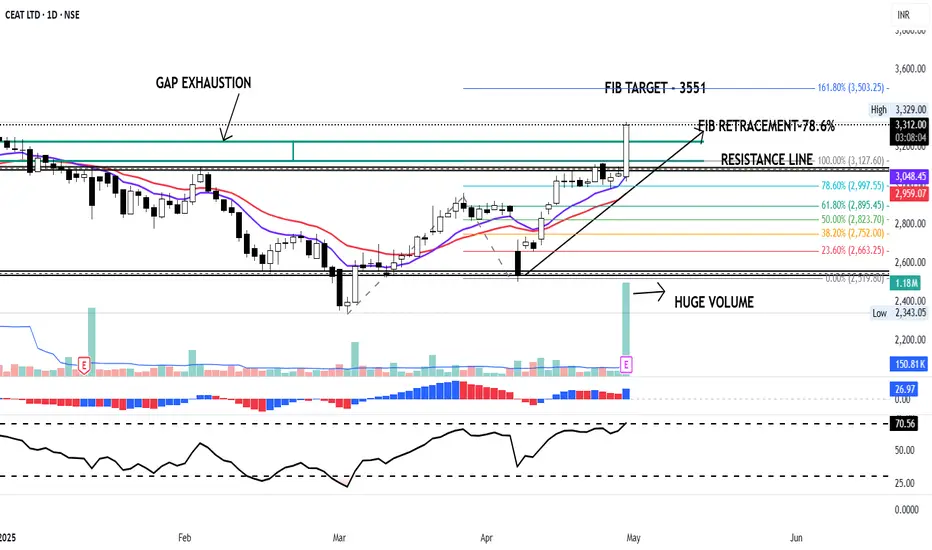
On the technical charts CEAT is looking very strong for the more upmove ahead. The stock has broken out of its Resitance zone of Rs.3050/3100 with strong volumes.
The stock has retraced 78.6% on 4th April which is considered a very good retracement according to the Fibonacci analysis. By using the Fibonacci extension tool the target for the stock comes to 3551 ( 161.8% target ).
The stock is trading above 11 and 22 days EMA, RSI is at 70 and MACD above zero line signifying bullish momentum. It has also exhausted the Gap created on the daily charts indicating the confidence in the stock.
Not a BUY/SELL RECOMNDATION
액티브 트레이드
Ceat performing as expected!!! 거래청산: 타겟 닿음
Achieved Target sooner than expected!!! :-) Happy investing!!!노트
Crazy Moves in Ceat. This is the power of Fibonacci. Looks like an extended wave. Cheers :-)노트
Another 4% today. Wow!! 면책사항
이 정보와 게시물은 TradingView에서 제공하거나 보증하는 금융, 투자, 거래 또는 기타 유형의 조언이나 권고 사항을 의미하거나 구성하지 않습니다. 자세한 내용은 이용 약관을 참고하세요.
면책사항
이 정보와 게시물은 TradingView에서 제공하거나 보증하는 금융, 투자, 거래 또는 기타 유형의 조언이나 권고 사항을 의미하거나 구성하지 않습니다. 자세한 내용은 이용 약관을 참고하세요.