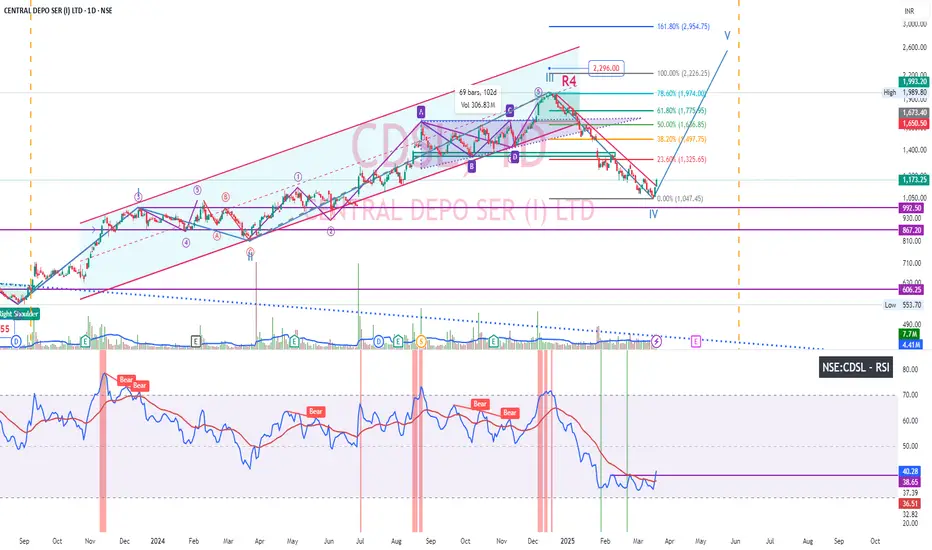
CDSL after reaching ascending triangle target exited parallel channel and corrected 37% and now taking up bullish reversal. Could see breakout in price chart of Daily timeframe. Also RSI breaking out after base formation. Weekly chart Bullish engulfing candlestick pattern.
액티브 트레이드
Increased position노트
CDSL if you've observed, it has bottomed out at bad results meaning market factored it. Hence didn't correct much on result day. Riding final wave관련 발행물
면책사항
이 정보와 게시물은 TradingView에서 제공하거나 보증하는 금융, 투자, 거래 또는 기타 유형의 조언이나 권고 사항을 의미하거나 구성하지 않습니다. 자세한 내용은 이용 약관을 참고하세요.
면책사항
이 정보와 게시물은 TradingView에서 제공하거나 보증하는 금융, 투자, 거래 또는 기타 유형의 조언이나 권고 사항을 의미하거나 구성하지 않습니다. 자세한 내용은 이용 약관을 참고하세요.