Breakout from Falling Wedge Pattern in CDSL
 CDSL
CDSL
📈Pattern & Setup:
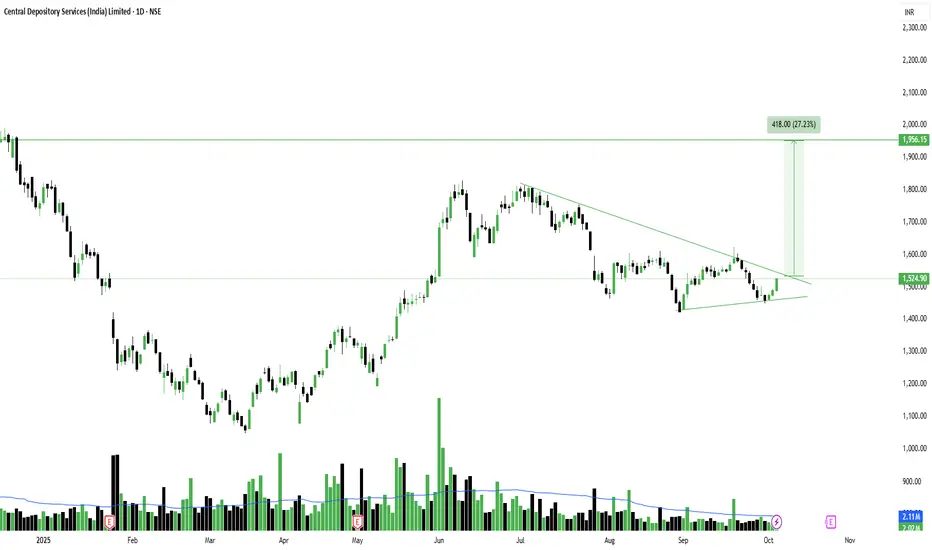
Central Depository Services (India) Ltd has just given a breakout from a falling wedge pattern on the daily chart. This pattern is widely known for signaling bullish reversals after a period of consolidation or correction.
Price action shows a clear downtrend losing momentum with higher lows forming near the wedge’s lower boundary. The breakout candle above 1520 comes with a noticeable spike in volume, suggesting active buyer participation and short-covering momentum.
📝 Trade Plan:
Entry: Around current levels of 1520–1530 looks favorable for early entry.
🚩Stop-Loss: 1460 (below the lower trendline and recent swing low).
🎯Targets:
Target 1 → 1750 (intermediate resistance level).
Target 2 → 1955 (measured move projection, around 27% upside).
💡Pyramiding Strategy:
1. Enter first lot near 1520–1530.
2. Add above 1600 on confirmation candle with volume, trail SL to 1490.
3. Add final lot above 1750 for continuation, trail SL to 1600.
Aim to ride the trend up to the 1950–1960 zone as momentum sustains.
🧠Logic Behind Selecting this Trade:
The wedge pattern shows decreasing selling pressure and increasing demand zones. The breakout accompanied by strong volume confirms the reversal bias. Structurally, this marks a potential end to the correction phase, paving the way for a new upward leg in CDSL.
Keep Learning. Keep Earning.
Let's grow together 📚🎯
🔴Disclaimer:
This is not an investment advice. Always do your own due diligence before making any trading or investment decision.
📈Pattern & Setup:
Central Depository Services (India) Ltd has just given a breakout from a falling wedge pattern on the daily chart. This pattern is widely known for signaling bullish reversals after a period of consolidation or correction.
Price action shows a clear downtrend losing momentum with higher lows forming near the wedge’s lower boundary. The breakout candle above 1520 comes with a noticeable spike in volume, suggesting active buyer participation and short-covering momentum.
📝 Trade Plan:
Entry: Around current levels of 1520–1530 looks favorable for early entry.
🚩Stop-Loss: 1460 (below the lower trendline and recent swing low).
🎯Targets:
Target 1 → 1750 (intermediate resistance level).
Target 2 → 1955 (measured move projection, around 27% upside).
💡Pyramiding Strategy:
1. Enter first lot near 1520–1530.
2. Add above 1600 on confirmation candle with volume, trail SL to 1490.
3. Add final lot above 1750 for continuation, trail SL to 1600.
Aim to ride the trend up to the 1950–1960 zone as momentum sustains.
🧠Logic Behind Selecting this Trade:
The wedge pattern shows decreasing selling pressure and increasing demand zones. The breakout accompanied by strong volume confirms the reversal bias. Structurally, this marks a potential end to the correction phase, paving the way for a new upward leg in CDSL.
Keep Learning. Keep Earning.
Let's grow together 📚🎯
🔴Disclaimer:
This is not an investment advice. Always do your own due diligence before making any trading or investment decision.
TrendX INC
관련 발행물
면책사항
해당 정보와 게시물은 금융, 투자, 트레이딩 또는 기타 유형의 조언이나 권장 사항으로 간주되지 않으며, 트레이딩뷰에서 제공하거나 보증하는 것이 아닙니다. 자세한 내용은 이용 약관을 참조하세요.
TrendX INC
관련 발행물
면책사항
해당 정보와 게시물은 금융, 투자, 트레이딩 또는 기타 유형의 조언이나 권장 사항으로 간주되지 않으며, 트레이딩뷰에서 제공하거나 보증하는 것이 아닙니다. 자세한 내용은 이용 약관을 참조하세요.