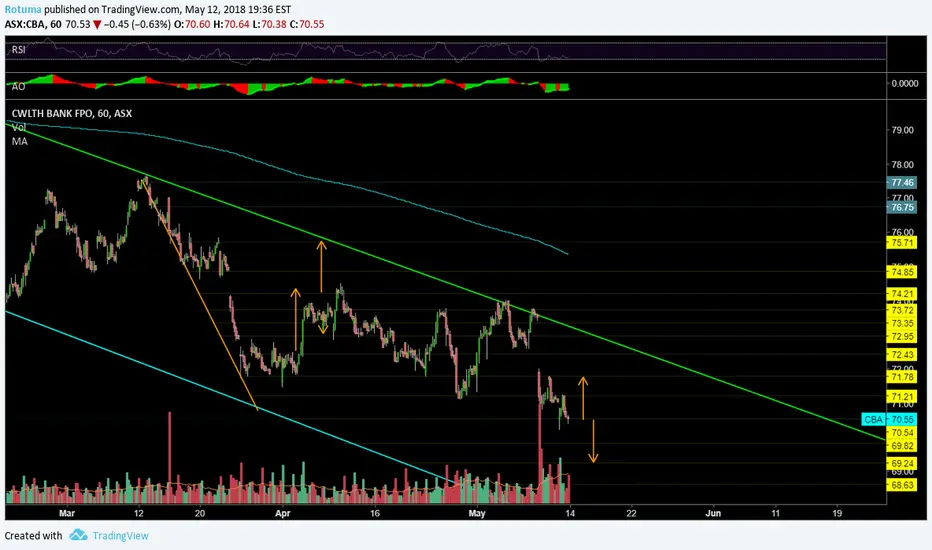
This is an update of my original chart created at the beginning of March 2018.just added extra support and resistance to the chart.
There were some interesting moves to the upside towards the end of April 2018, I was monitoring closely for a signal of changes to the direction of price movement as volume and momentum serged to the upside in hope of breaking out of the downward price channel. unfortunately, share prices had two failed attempts and gapped down on 9th of May 2018. Share prices closed the last trading session in the middle of the price channel at 70.53 down by -0.63%.
Share prices need to hold the current support at around 70.54 before any attempts to get back up to the top of the price channel at around 71.21 and 71.28. Failure could see prices fall to the next two support at around 69.82 or 69.24. There are other support and resistance marked on the chart for future references.
면책사항
해당 정보와 게시물은 금융, 투자, 트레이딩 또는 기타 유형의 조언이나 권장 사항으로 간주되지 않으며, 트레이딩뷰에서 제공하거나 보증하는 것이 아닙니다. 자세한 내용은 이용 약관을 참조하세요.
면책사항
해당 정보와 게시물은 금융, 투자, 트레이딩 또는 기타 유형의 조언이나 권장 사항으로 간주되지 않으며, 트레이딩뷰에서 제공하거나 보증하는 것이 아닙니다. 자세한 내용은 이용 약관을 참조하세요.