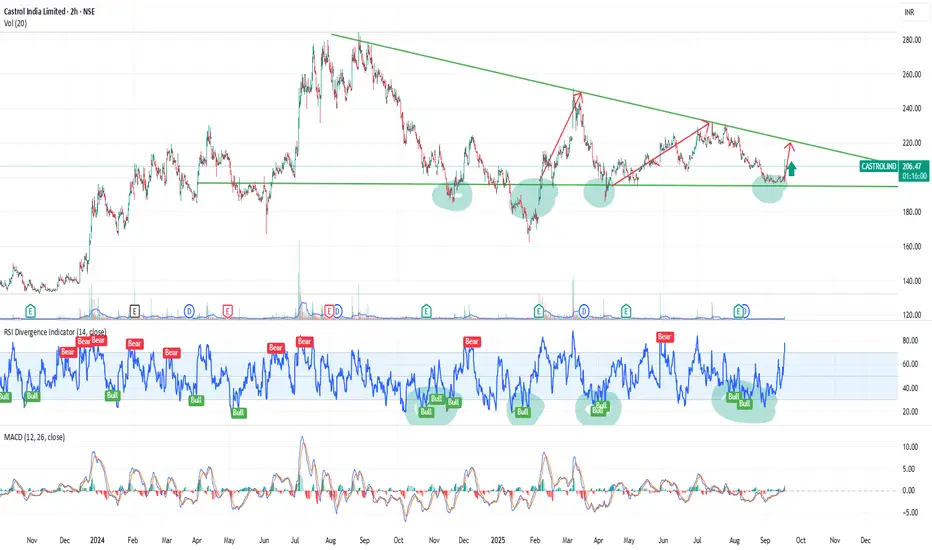
This chart showcases a symmetrical triangle pattern, where the price consolidates between two converging trendlines, indicating a period of market indecision. The formation of lower highs and higher lows suggests that the price is narrowing, setting up for a potential breakout.
Technically, the RSI is showing a bullish divergence as it rises from the oversold zone, while the MACD is crossing into positive territory, further supporting the possibility of an upward move. Volume indicators also highlight increasing interest, suggesting the potential for a breakout in the near term.
This is only view of my side by analysys of chart.
Note:
This analysis is purely for educational purposes and should not be considered as financial advice or a trading recommendation. Always conduct thorough research and consult a financial professional before making any trading decisions.
액티브 트레이드
As this stock has at level bottom which is its support and also fundmental is strong this stock. which would take this up in long term.관련 발행물
면책사항
해당 정보와 게시물은 금융, 투자, 트레이딩 또는 기타 유형의 조언이나 권장 사항으로 간주되지 않으며, 트레이딩뷰에서 제공하거나 보증하는 것이 아닙니다. 자세한 내용은 이용 약관을 참조하세요.
면책사항
해당 정보와 게시물은 금융, 투자, 트레이딩 또는 기타 유형의 조언이나 권장 사항으로 간주되지 않으며, 트레이딩뷰에서 제공하거나 보증하는 것이 아닙니다. 자세한 내용은 이용 약관을 참조하세요.