📊 Key current context
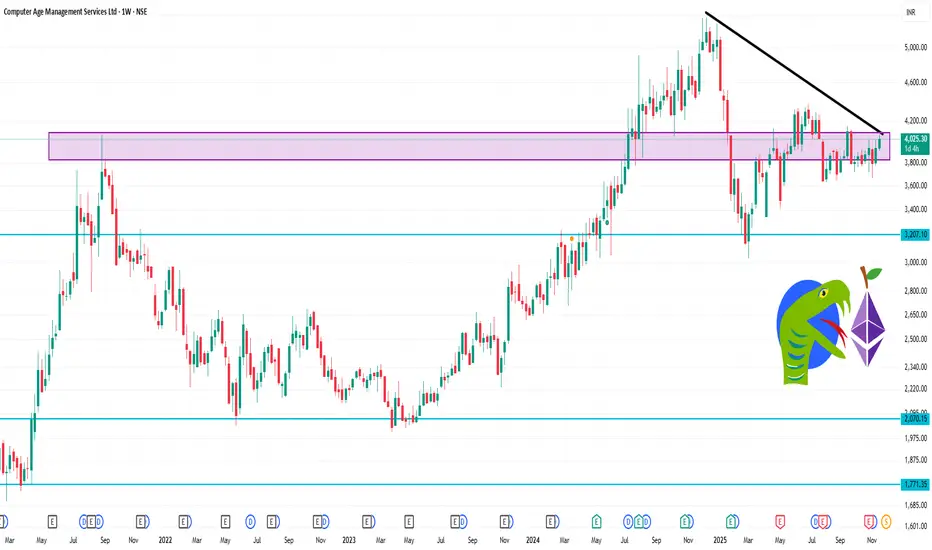
The stock is trading around ₹4,020 to ₹4,040 (approx).
52-week range: ~₹3,031 (low) to ~₹5,367 (high).
Technical pivot data shows weekly support/resistance and pivot levels.
If price holds above ~₹3,900-₹4,000 zone and shows strength, a move toward ~₹4,100-₹4,150 is plausible.
If price breaks below ~₹3,900 decisively, then ~₹3,800 and even ~₹3,670 could become the next zones to watch.
Break above ~₹4,150-₹4,200 would increase odds of testing ~₹4,300-₹4,400 zone.
⚠️ Things to watch & caveats
The technical levels are approximate and different sources give slightly different numbers; always use stop-loss discipline.
Weekly charts smooth out short-term noise, but in volatile sectors things can move fast.
Always check for upcoming news, earnings, macro conditions, as these can override technicals.
These levels are not guaranteed entry/exit signals — treat them as potential zones.
관련 발행물
면책사항
해당 정보와 게시물은 금융, 투자, 트레이딩 또는 기타 유형의 조언이나 권장 사항으로 간주되지 않으며, 트레이딩뷰에서 제공하거나 보증하는 것이 아닙니다. 자세한 내용은 이용 약관을 참조하세요.
관련 발행물
면책사항
해당 정보와 게시물은 금융, 투자, 트레이딩 또는 기타 유형의 조언이나 권장 사항으로 간주되지 않으며, 트레이딩뷰에서 제공하거나 보증하는 것이 아닙니다. 자세한 내용은 이용 약관을 참조하세요.
