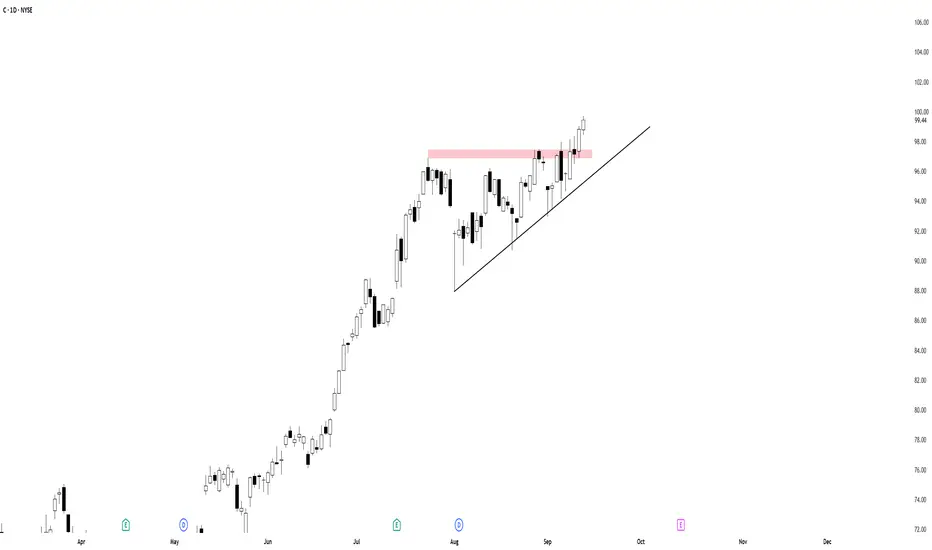
The price has broken out of an ascending triangle pattern formed between $95 and $98, showing strong follow-through. This breakout signals continuation of the prevailing uptrend.
Technical Setup: Clear series of higher lows, resistance around $97.50–$98 finally broken with a strong bullish candle.
Target: Measured move projects to around $106 ±0.5, based on the height of the triangle added to the breakout level.
Stop Loss: Immediate invalidation below $96.80 (breakout failure).
Alternative Exit: If the breakout shows soft weakness (limited follow-through, mild pullback), a wider stop can be placed under $95 (bottom of the triangle) to allow for a retest before resuming trend.
This structure suggests bullish continuation as long as price remains above the breakout zone. A retest of $97.50–$98 could offer a secondary entry opportunity.
거래청산: 타겟 닿음
Shinobi Trading Lab – Indicators • Stats • Discipline
👉 Patreon: patreon.com/ShinobiTradingLab
👉 Patreon: patreon.com/ShinobiTradingLab
면책사항
이 정보와 게시물은 TradingView에서 제공하거나 보증하는 금융, 투자, 거래 또는 기타 유형의 조언이나 권고 사항을 의미하거나 구성하지 않습니다. 자세한 내용은 이용 약관을 참고하세요.
Shinobi Trading Lab – Indicators • Stats • Discipline
👉 Patreon: patreon.com/ShinobiTradingLab
👉 Patreon: patreon.com/ShinobiTradingLab
면책사항
이 정보와 게시물은 TradingView에서 제공하거나 보증하는 금융, 투자, 거래 또는 기타 유형의 조언이나 권고 사항을 의미하거나 구성하지 않습니다. 자세한 내용은 이용 약관을 참고하세요.