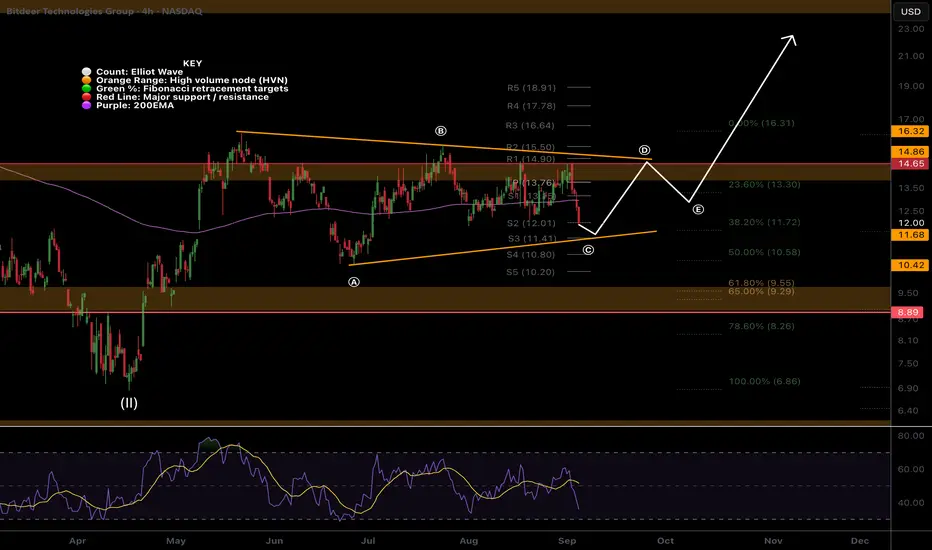
Wave c of an ABC within a triangle wave (C) appears to be underway with price closing below both the daily pivot and 200EMA. RSI has slight bullish divergence.
Until we get a break below wave (A) or a above wave (B) the analysis is good. Will readjust and update if anything changes. A breakdown below the triangle has a wave 2 target of the golden pocket Fibonacci retracement and HVN support at $9.63 and may offer a great buying opportunity.
Breakout target is the R5 daily pivot at $21.84
Safe trading
PhD Cand: Investing & Sentiment , MSc Financial Econ
Trader 8 years, Investor 15 years
The Sentiment Investor - Market Psychology: thesentimentinvestor.substack.com
Trade Planning, Strategies & Signals: Earn & Learn: tradesignals.substack.com
Trader 8 years, Investor 15 years
The Sentiment Investor - Market Psychology: thesentimentinvestor.substack.com
Trade Planning, Strategies & Signals: Earn & Learn: tradesignals.substack.com
관련 발행물
면책사항
해당 정보와 게시물은 금융, 투자, 트레이딩 또는 기타 유형의 조언이나 권장 사항으로 간주되지 않으며, 트레이딩뷰에서 제공하거나 보증하는 것이 아닙니다. 자세한 내용은 이용 약관을 참조하세요.