Bitcoin ( BTC ) price trades below $109,000 at the time of writing on Friday after slipping nearly 5% so far this week
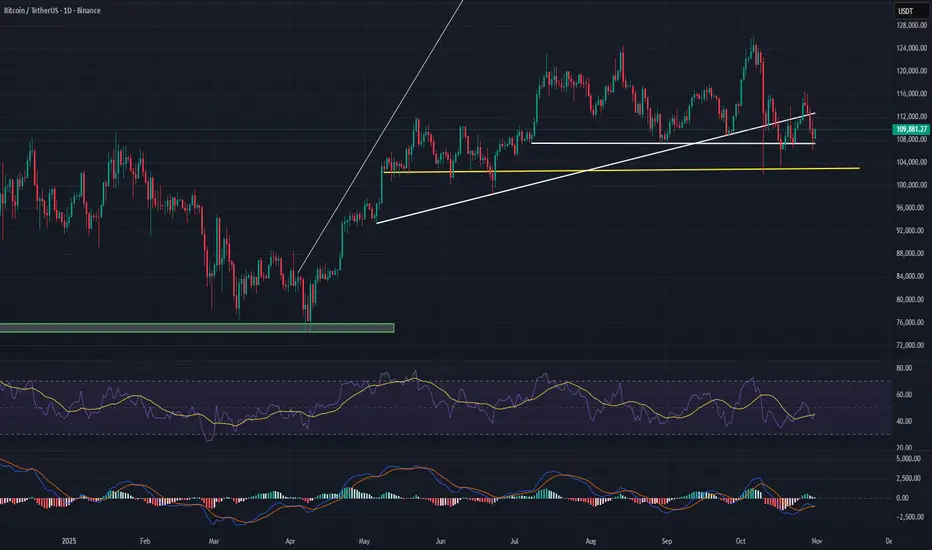
BTC price was rejected from the Trend line (drawn from the April 7 low of $74,508 to the October 6 all-time high of $126,199) at $115,137 on Monday, and declined 5.44% by Thursday. At the time of writing on Friday, BTC hovers at around $110,000.
If BTC continues its correction and closes below $106,453, it could extend the decline toward the October 10 low of $102,000.
The Relative Strength Index (RSI) on the daily chart reads 45, below the neutral level of 50, indicating bearish momentum gaining traction. The Moving Average Convergence Divergence (MACD) lines are also converging, with decreasing green histogram bars signaling fading bullish momentum.
However, if BTC finds support around $106,453, it could extend the recovery toward the $112,872.
면책사항
이 정보와 게시물은 TradingView에서 제공하거나 보증하는 금융, 투자, 거래 또는 기타 유형의 조언이나 권고 사항을 의미하거나 구성하지 않습니다. 자세한 내용은 이용 약관을 참고하세요.
면책사항
이 정보와 게시물은 TradingView에서 제공하거나 보증하는 금융, 투자, 거래 또는 기타 유형의 조언이나 권고 사항을 의미하거나 구성하지 않습니다. 자세한 내용은 이용 약관을 참고하세요.