Overview
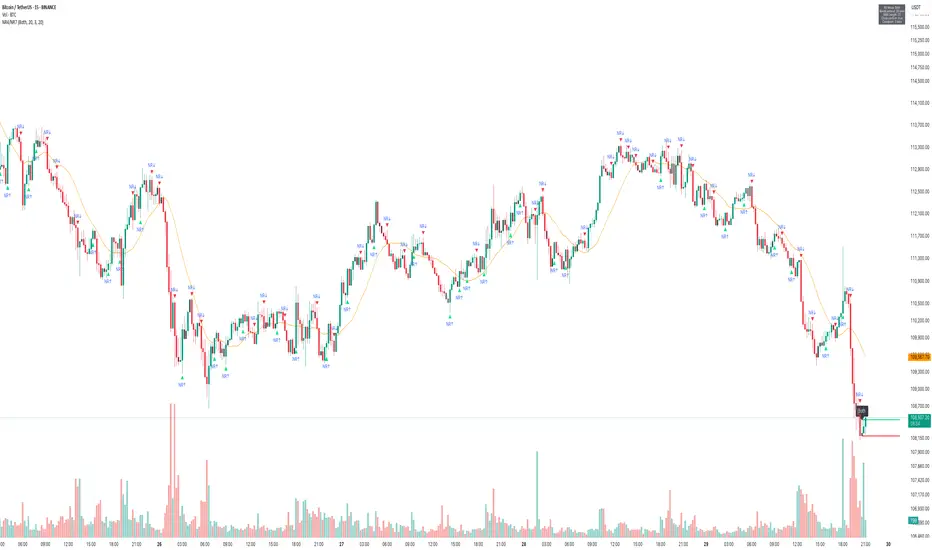
The NR4/NR7 Volatility Squeeze & Breakouts indicator highlights narrow range bars (the tightest candles in the last 4 or 7 bars).
These patterns often signal price contraction before an expansion move.
Performance Snapshot from the Chart
• Multiple NR4/NR7 labels appeared during sideways phases, correctly highlighting compression zones.
• Breakouts above/below the marked levels often triggered short directional bursts.
• The final cluster near the right edge (orange NR bar) preceded a sharp downside breakout, confirmed by both price and volume.
• The 20-period SMA acted as a bias filter:
• Breakouts below the SMA during the downtrend aligned with stronger moves.
• Breakouts against the SMA were generally weaker or faded quickly.
Key Observations
1. Clustering of NR Bars:
• When NR4/NR7 patterns cluster together, it often signals that a bigger move is loading.
2. Breakout Triggers:
• The High/Low of the NR bar served as clean breakout reference levels.
3. Volume Confirmation:
• Strong moves (especially the last breakdown) came with spikes in volume, adding conviction.
How Traders Can Use This
• Identify Volatility Contraction: Spot NR4/NR7 bars as potential setups.
• Set Levels: Use NR High/Low for breakout triggers.
• Add Filters: Combine with trend (SMA), volume, or support/resistance for stronger conviction.
• Risk Management: Opposite side of the NR bar can serve as a logical stop level.
Thanks.
TradeTech Analysis
Telegram Channel - t.me/Tradetech2024
Youtube Channel - youtube.com/@TradeTechAnalysis
Website - tradetechanalysis.com/
Super Profile - superprofile.bio/tradetechanalysis
TradeTech Analysis
Telegram Channel - t.me/Tradetech2024
Youtube Channel - youtube.com/@TradeTechAnalysis
Website - tradetechanalysis.com/
Super Profile - superprofile.bio/tradetechanalysis
면책사항
이 정보와 게시물은 TradingView에서 제공하거나 보증하는 금융, 투자, 거래 또는 기타 유형의 조언이나 권고 사항을 의미하거나 구성하지 않습니다. 자세한 내용은 이용 약관을 참고하세요.