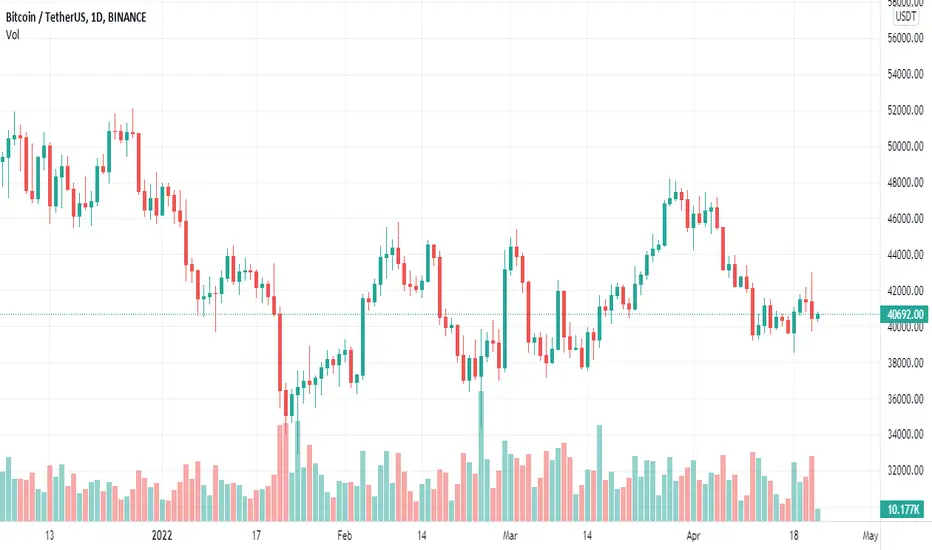
Past Performance of Bitcoin
After sharp upside moves in the European and early New York sessions on April 21, Bitcoin prices plunged to close the day as an inverted hammer. The long upper wick points to strong selling pressure, unwinding gains posted in the days as prices reacted from the previous support--and now resistance--multi-week trend line. Based on the development in the daily chart, #BTC seems to have completed a retest.
Bitcoin Technical Analysis
Traders remain apprehensive at spot rates. Even after the complete reversal of April 11 losses and the close above the $42.5k level, sellers didn't sustain prices above $42k, indicating weakness. The uptrend has been nullified following the April 21 inverted hammer and prices trending below $42.5k. Prices are pulling back from the liquidation trend line, completing a retest. Sellers might ride with the newfound trend, targeting $39.5k in what could be a bear trend confirmation of the April 11 leg down.
What to Expect from #BTC?
The reversal from April 21 highs pours cold water on bulls' momentum. Since prices are now back within the April 11 trade range and $42.5k, the selling pressure of April 21 may spill over, possibly forcing BTC towards $40k in the short term.
Resistance level to watch out for: $42.5k
Support level to watch out for: $39.5k
Disclaimer: Opinions expressed are not investment advice. Do your research.
관련 발행물
면책사항
해당 정보와 게시물은 금융, 투자, 트레이딩 또는 기타 유형의 조언이나 권장 사항으로 간주되지 않으며, 트레이딩뷰에서 제공하거나 보증하는 것이 아닙니다. 자세한 내용은 이용 약관을 참조하세요.
면책사항
해당 정보와 게시물은 금융, 투자, 트레이딩 또는 기타 유형의 조언이나 권장 사항으로 간주되지 않으며, 트레이딩뷰에서 제공하거나 보증하는 것이 아닙니다. 자세한 내용은 이용 약관을 참조하세요.