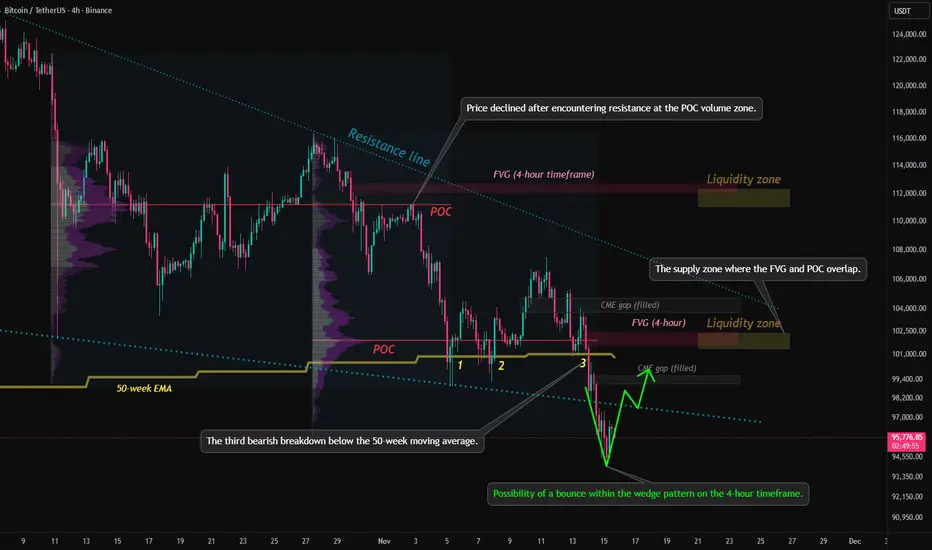
1. Trend Structure
2. Key Price Levels and Indicators
3. Liquidity Zones
4. FVG (Fair Value Gap)
5. CME Gap
6. Current Market Structure Interpretation
7. Potential Formation of a Lower Wedge Pattern
8. USDT.D Chart Analysis

9. Summary
If you found this content helpful, feel free to support with a boost (🚀) and a comment (💬).
Your encouragement helps drive better analysis and more valuable content.
Follow the page to receive notifications (🔔) for future posts.
- The descending trendline (Resistance line) at the top of the chart remains valid.
- The price has repeatedly faced rejection at this level, indicating that the medium-term downtrend is still intact.
2. Key Price Levels and Indicators
- 50-week EMA
The price has recently recorded its third downward break below the 50-week EMA.
From a traditional technical perspective, this is viewed as a signal that strengthens the possibility of a medium- to long-term bearish shift. - POC (Point of Control)
The mid-range POC is acting as a strong supply zone,
and recent rebound attempts have also failed to break above this level decisively.
3. Liquidity Zones
- Two major liquidity zones are marked in the upper and mid sections of the chart.
Liquidity zone near 112k (upper zone) - A cluster of large liquidity pockets and liquidation points
- If a short-term rebound occurs, this is the first upside target likely to be tested
Liquidity zone near 102k (mid zone) - Overlaps with the 4h FVG, making it a level closely watched by both buyers and sellers
4. FVG (Fair Value Gap)
- Multiple FVGs are present on the 4-hour timeframe, with some already filled.
- Unfilled FVGs have a high probability of being revisited as the market corrects in the future.
5. CME Gap
- All weekday CME gaps have already been filled and may act as short-term resistance.
- A weekend gap forms when Monday’s CME opening price starts above 95.4K.
6. Current Market Structure Interpretation
- The price is currently attempting a rebound from the lower boundary of the downtrend.
- However, several resistance layers overlap—POC, FVG zones, and trendline resistance—raising the likelihood of heavy selling pressure on any upward move.
- In the short term, volatility consolidation is expected within the 96k–100k range.
7. Potential Formation of a Lower Wedge Pattern
- The price has broken below the lower boundary of the wedge pattern, accompanied by rising volume.
- A short-term rebound is likely, and if the price re-enters the wedge, further upside momentum may follow.
- If the lower trendline is not reclaimed, the structure may shift into a range after a retest.
8. USDT.D Chart Analysis
- The price has once again touched the upper boundary of a downtrend line that has persisted for over a year.
- Downward pressure on the USDT dominance chart suggests potential upward momentum for Bitcoin.
- Technically, this zone offers conditions supportive of a short-term rebound.
9. Summary
- The medium-term trend remains bearish, with the ongoing breakdown below the 50-week EMA reinforcing a sustained bearish outlook.
- A short-term bottoming attempt is visible, but dense supply overhead limits the strength of any rebound.
- FVGs, POC, and liquidity zones overlap near the current price region, increasing the probability of heightened volatility.
If you found this content helpful, feel free to support with a boost (🚀) and a comment (💬).
Your encouragement helps drive better analysis and more valuable content.
Follow the page to receive notifications (🔔) for future posts.
Followers only! free early access.
Coming soon! all-in-one indicators dashboard📊
Please wait for news after follow and boost🚀
We are fully dedicated to developing a system.
Stay tuned for news on FREE early access!🎯
Coming soon! all-in-one indicators dashboard📊
Please wait for news after follow and boost🚀
We are fully dedicated to developing a system.
Stay tuned for news on FREE early access!🎯
면책사항
해당 정보와 게시물은 금융, 투자, 트레이딩 또는 기타 유형의 조언이나 권장 사항으로 간주되지 않으며, 트레이딩뷰에서 제공하거나 보증하는 것이 아닙니다. 자세한 내용은 이용 약관을 참조하세요.
