#Bitcoin – Corrective Structure Developing
Current price: $110,350
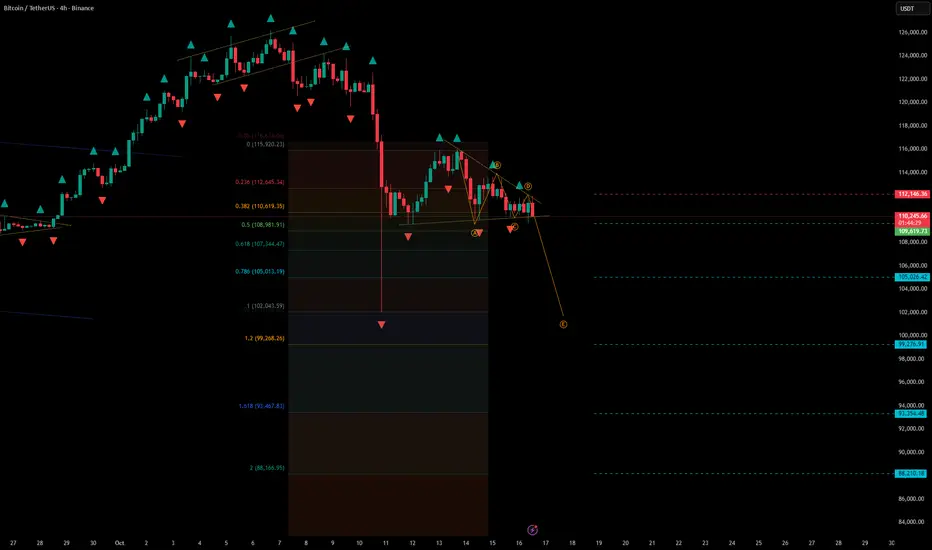
Bitcoin continues to trade inside a corrective structure, suggesting the market may be preparing for another downward leg before a potential recovery.
🧩 Technical Overview
• Price failed to hold above the $112,000 resistance zone and has since formed a descending pattern, likely part of an ABC correction.
• The local structure shows repeated lower highs and compression around $110,000, confirming seller control in the short term.
• The correction remains active while price stays below $112,000–$112,500.
📉 Scenario
• The market is forming a short-term bearish continuation pattern, with potential extension toward deeper Fibonacci supports.
• Stop-loss: above the $112,000 resistance zone.
• Downside zones to watch:
– $108,900–$107,300 — initial support area (0.5–0.618 Fib range)
– $105,000 — critical pivot zone
– $99,000–$100,000 — key Fibonacci cluster and potential short-term bottom
– $93,000–$88,000 — extended target range if pressure intensifies
⚙️ Market Context
• BTC remains in a corrective pullback phase following a strong September rally.
• Broader sentiment shows reduced risk appetite across crypto and macro assets.
• A sustained break below $105,000 could accelerate selling pressure, while recovery above $112,000 would invalidate the bearish scenario.
🧭 Summary
Bitcoin continues to consolidate within a corrective pattern, leaning bearish below $112,000.
Short-term momentum favors further downside toward $105,000–$99,000, with deeper extensions possible near $93,000–$88,000.
Until a breakout confirms otherwise, the bias remains cautiously bearish in the near term.
Current price: $110,350
Bitcoin continues to trade inside a corrective structure, suggesting the market may be preparing for another downward leg before a potential recovery.
🧩 Technical Overview
• Price failed to hold above the $112,000 resistance zone and has since formed a descending pattern, likely part of an ABC correction.
• The local structure shows repeated lower highs and compression around $110,000, confirming seller control in the short term.
• The correction remains active while price stays below $112,000–$112,500.
📉 Scenario
• The market is forming a short-term bearish continuation pattern, with potential extension toward deeper Fibonacci supports.
• Stop-loss: above the $112,000 resistance zone.
• Downside zones to watch:
– $108,900–$107,300 — initial support area (0.5–0.618 Fib range)
– $105,000 — critical pivot zone
– $99,000–$100,000 — key Fibonacci cluster and potential short-term bottom
– $93,000–$88,000 — extended target range if pressure intensifies
⚙️ Market Context
• BTC remains in a corrective pullback phase following a strong September rally.
• Broader sentiment shows reduced risk appetite across crypto and macro assets.
• A sustained break below $105,000 could accelerate selling pressure, while recovery above $112,000 would invalidate the bearish scenario.
🧭 Summary
Bitcoin continues to consolidate within a corrective pattern, leaning bearish below $112,000.
Short-term momentum favors further downside toward $105,000–$99,000, with deeper extensions possible near $93,000–$88,000.
Until a breakout confirms otherwise, the bias remains cautiously bearish in the near term.
면책사항
이 정보와 게시물은 TradingView에서 제공하거나 보증하는 금융, 투자, 거래 또는 기타 유형의 조언이나 권고 사항을 의미하거나 구성하지 않습니다. 자세한 내용은 이용 약관을 참고하세요.
면책사항
이 정보와 게시물은 TradingView에서 제공하거나 보증하는 금융, 투자, 거래 또는 기타 유형의 조언이나 권고 사항을 의미하거나 구성하지 않습니다. 자세한 내용은 이용 약관을 참고하세요.