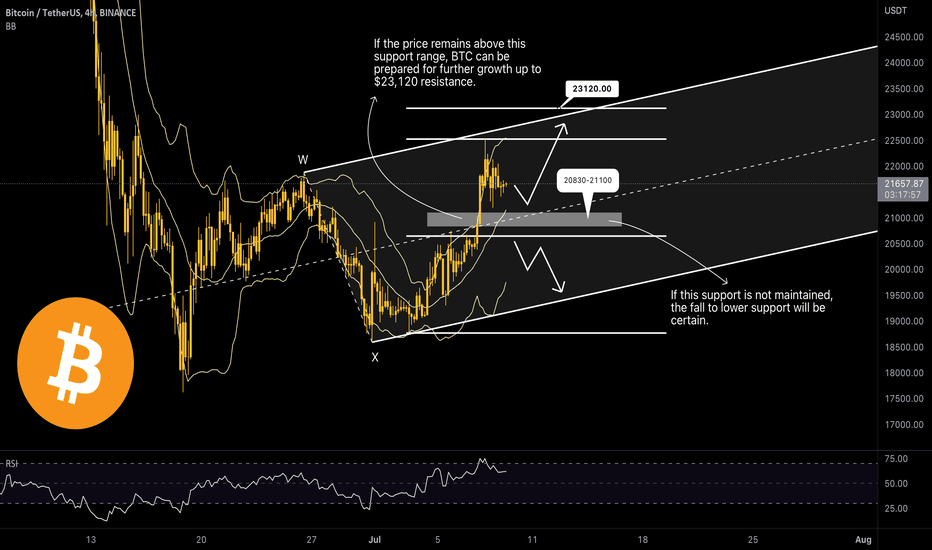
The bearish scenario is still more likely
업데이트됨

Hello to all members of TradingView and my followers.
Well, Bitcoin failed to breach the $20,500 resistance area and thus started the decline. There was immediate support on the downside near the $20,000 level, which failed to stop Bitcoin.
Bitcoin's next major support is near the 50% retracement fib at $19,568. The price could now fall sharply due to the recent rise from $18,738 to $20,450. The price may drop to the $18,720 level.
Thus, in my opinion, the bearish scenario is still more likely, and yesterday's green candle still does not give any confirmation of the immediate rise of the market.
If it is helpful to you, please like it. If you have a comment, I'll be happy to know. Respectfully.
노트
Exchange reserves continue to see large-scale net withdrawals, with aggregate balances declining to levels last seen in July 2018.Overall balance on Exchanges has seen an aggregate outflow of -750K #BTC since March 2020.
The last three months alone have seen some 142.5K #BTC in outflows, a remarkable 18.8% of the total.
노트
Since last week until now, Bitcoin has not enjoyed the general interest of the market and has faced a decrease of 8.3%.
After the important support level of $19,700 was broken last week, it showed that the appetite of the bears is increasing. Especially since the European Union is the next country that will increase its interest rates and another important economic area has joined the game of implementing repressive policies.
Meanwhile, the inflation rate for this period is still likely to increase. It is expected that the rate reached 8.6% last month and will get 8.7% for this period. It is a strong warning to the market that the Fed will hit the bloated economy harder.
Considering this prevailing market atmosphere, which has no result other than further suppression of risky assets, it is more rational to consider price stabilization patterns as a series of continuing patterns.
A symmetrical triangle pattern is formed in the four-hour time frame, which has made the scenario easy for traders.
Price stabilization below the 18,900-18,770 range is a sign of the completion of the pattern, which makes the expectation of a further price drop to the $16,450 range.
노트
Bitcoin recorded a strong upward movement yesterday with support in the $19,000 range.
This price growth, which led to the breaking of the ceiling of the range channel at $19,568, has continued up to $20,500.
Bitcoin is currently in a narrow ascending channel, and even if the bottom of the channel is broken, there is potential for another attempt at the $19,840-$19,568 support range for the $21,000 resistance.
💎 We believe that everyone can trade and deserves the opportunity to succeed in the world of cryptocurrency and take advantage of its potential.
🥇Join our free Telegram channel ➜ t.me/monocoin_public
👤Admin ➜ t.me/monocoin_admin
🥇Join our free Telegram channel ➜ t.me/monocoin_public
👤Admin ➜ t.me/monocoin_admin
관련 발행물
면책사항
이 정보와 게시물은 TradingView에서 제공하거나 보증하는 금융, 투자, 거래 또는 기타 유형의 조언이나 권고 사항을 의미하거나 구성하지 않습니다. 자세한 내용은 이용 약관을 참고하세요.

