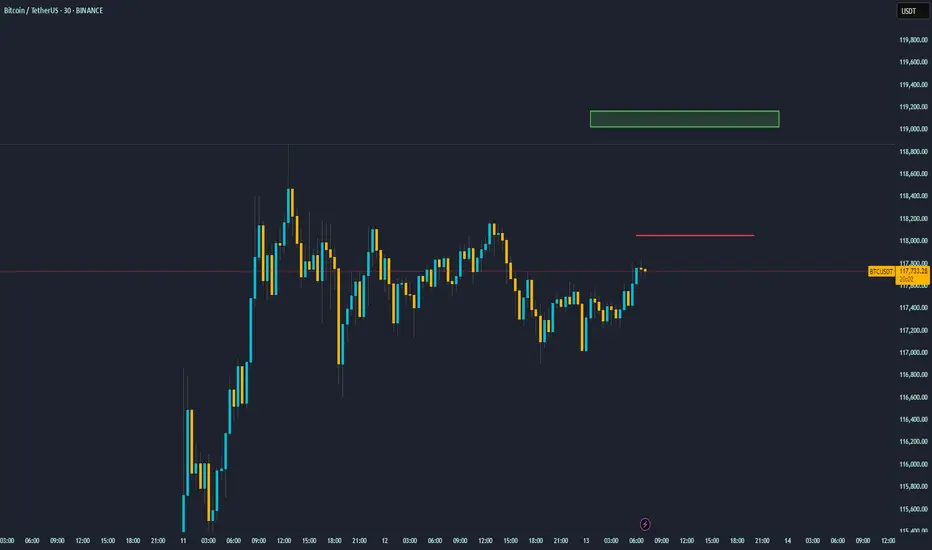
This 30-minute chart for Bitcoin (BTC/USDT) shows the price consolidating within a range after a strong upward rally. The key levels drawn on the chart outline a potential trading plan for the next short-term move.
Asset: Bitcoin / TetherUS (BTC/USDT)
Timeframe: 30-Minute (Short-term outlook)
Current Situation: After a significant price surge on July 11th, Bitcoin has entered a sideways consolidation phase. The price is currently making a move towards the top of this range, approaching a critical resistance level.
Key Levels Explained
Immediate Resistance (~$118,000): The red horizontal line marks the immediate resistance. This is a crucial level that has previously rejected the price. For the current upward momentum to continue, Bitcoin must decisively break and hold above this price ceiling.
Primary Target / Supply Zone (~$118,900 - $119,100): The green box above represents the next major resistance area or "supply zone." This is the logical target for bulls if they can successfully break through the immediate $118,000 resistance.
Potential Scenarios
Bullish Scenario: If Bitcoin breaks through the $118,000 red line with strong volume, it would signal a potential continuation of the uptrend. Traders would then look towards the green box around $119,000 as the next take-profit area.
Bearish Scenario: If Bitcoin fails to break the $118,000 resistance and gets rejected, it is likely to fall back towards the lower end of its current range. The recent lows around $117,000 - $117,200 would act as the first line of support.
면책사항
해당 정보와 게시물은 금융, 투자, 트레이딩 또는 기타 유형의 조언이나 권장 사항으로 간주되지 않으며, 트레이딩뷰에서 제공하거나 보증하는 것이 아닙니다. 자세한 내용은 이용 약관을 참조하세요.
면책사항
해당 정보와 게시물은 금융, 투자, 트레이딩 또는 기타 유형의 조언이나 권장 사항으로 간주되지 않으며, 트레이딩뷰에서 제공하거나 보증하는 것이 아닙니다. 자세한 내용은 이용 약관을 참조하세요.