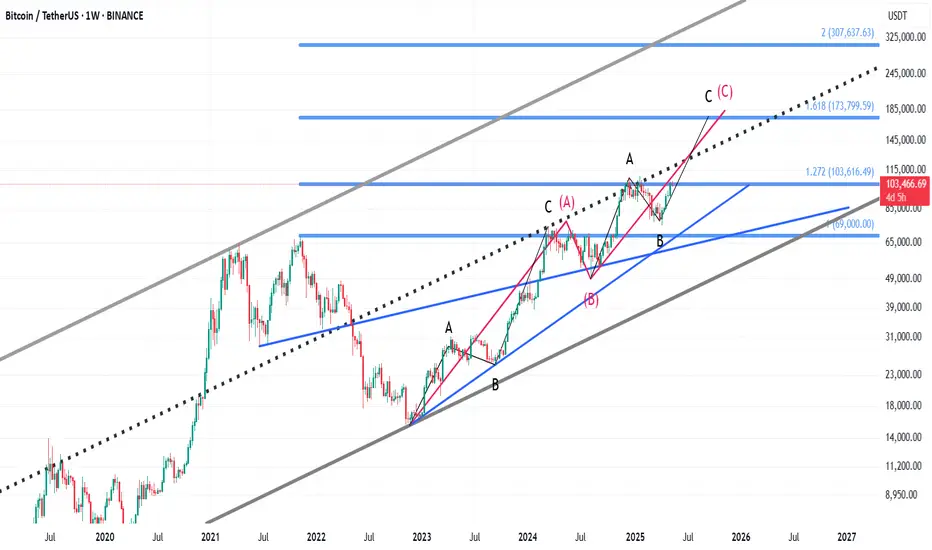
After crashing from its $69K peak (Nov 2021) to $15,476 (Nov 2022), Bitcoin has entered a bullish Elliott Wave structure, forming a classic 3-wave corrective pattern:
🔹 Wave A: Rally to $73,777 (with internal abc structure)
🔹 Wave B: Pullback to $49,000
🔹 Wave C: Currently unfolding — with a potential target at $180K
Within Wave C:
✅ Wave a: Pushed to $109K
✅ Wave b: Corrected down to 73K
73K
✅ Wave c: Now beginning and approaching a key breakout point
📌 The critical level? A daily candle close above $109K
If that happens, Bitcoin could enter its final impulsive leg toward $180K.
All technical signs point toward a major move — the structure, volume, and price action are aligned for what could be a historic breakout.
🔹 Wave A: Rally to $73,777 (with internal abc structure)
🔹 Wave B: Pullback to $49,000
🔹 Wave C: Currently unfolding — with a potential target at $180K
Within Wave C:
✅ Wave a: Pushed to $109K
✅ Wave b: Corrected down to
✅ Wave c: Now beginning and approaching a key breakout point
📌 The critical level? A daily candle close above $109K
If that happens, Bitcoin could enter its final impulsive leg toward $180K.
All technical signs point toward a major move — the structure, volume, and price action are aligned for what could be a historic breakout.
액티브 트레이드
Bitcoin has broken above $109,300 with a daily close, confirming entry into a new bullish wave. The next potential target lies in the $180K range. Momentum favors further upside.면책사항
이 정보와 게시물은 TradingView에서 제공하거나 보증하는 금융, 투자, 거래 또는 기타 유형의 조언이나 권고 사항을 의미하거나 구성하지 않습니다. 자세한 내용은 이용 약관을 참고하세요.
면책사항
이 정보와 게시물은 TradingView에서 제공하거나 보증하는 금융, 투자, 거래 또는 기타 유형의 조언이나 권고 사항을 의미하거나 구성하지 않습니다. 자세한 내용은 이용 약관을 참고하세요.