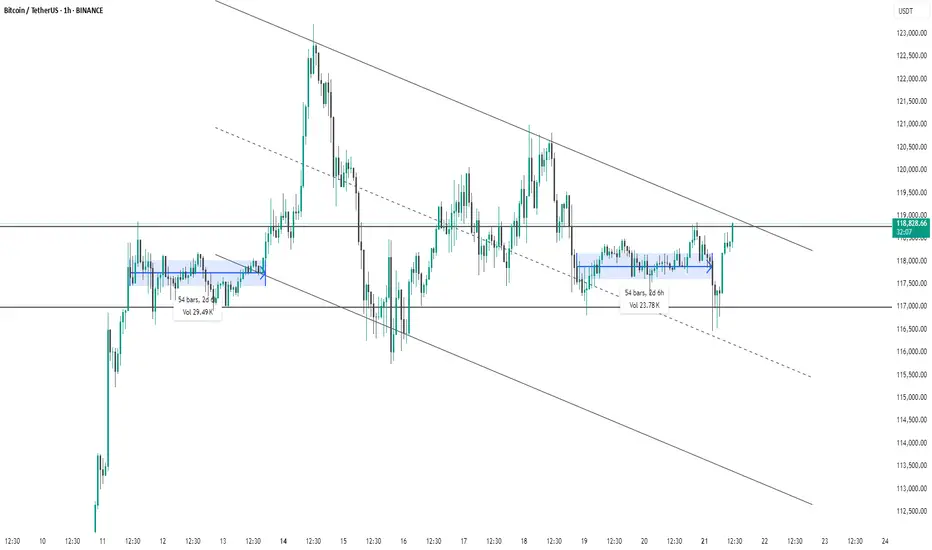
This 1-hour chart of Bitcoin/USDT (Binance) shows a descending channel pattern with clearly defined upper and lower trendlines. Price has recently broken out of a consolidation zone (highlighted in blue) and is now testing the upper boundary of the descending channel near $119,000. The breakout from the recent range (lasting 54 bars / 2d 6h with 23.78K volume) suggests bullish momentum. However, for confirmation of trend reversal, a strong breakout above the channel is needed. Until then, the broader downtrend structure remains intact.
thanking you
thanking you
관련 발행물
면책사항
이 정보와 게시물은 TradingView에서 제공하거나 보증하는 금융, 투자, 거래 또는 기타 유형의 조언이나 권고 사항을 의미하거나 구성하지 않습니다. 자세한 내용은 이용 약관을 참고하세요.
면책사항
이 정보와 게시물은 TradingView에서 제공하거나 보증하는 금융, 투자, 거래 또는 기타 유형의 조언이나 권고 사항을 의미하거나 구성하지 않습니다. 자세한 내용은 이용 약관을 참고하세요.